QUESTION IMAGE
Question
part ii
answer all 8 questions in this part. each correct ans receive 2 credits. clearly indicate the necessary steps, including appropriate for substitutions, diagrams, graphs, charts, etc. utilize the information provided for each question to determine your answer. note that diagrams are not necessarily drawn to scale. for all questions in this part, a correct numerical answer with no work shown will receive only 1 credit. all answers should be written in pen, except for graphs and drawings, which should be done in pencil. 16
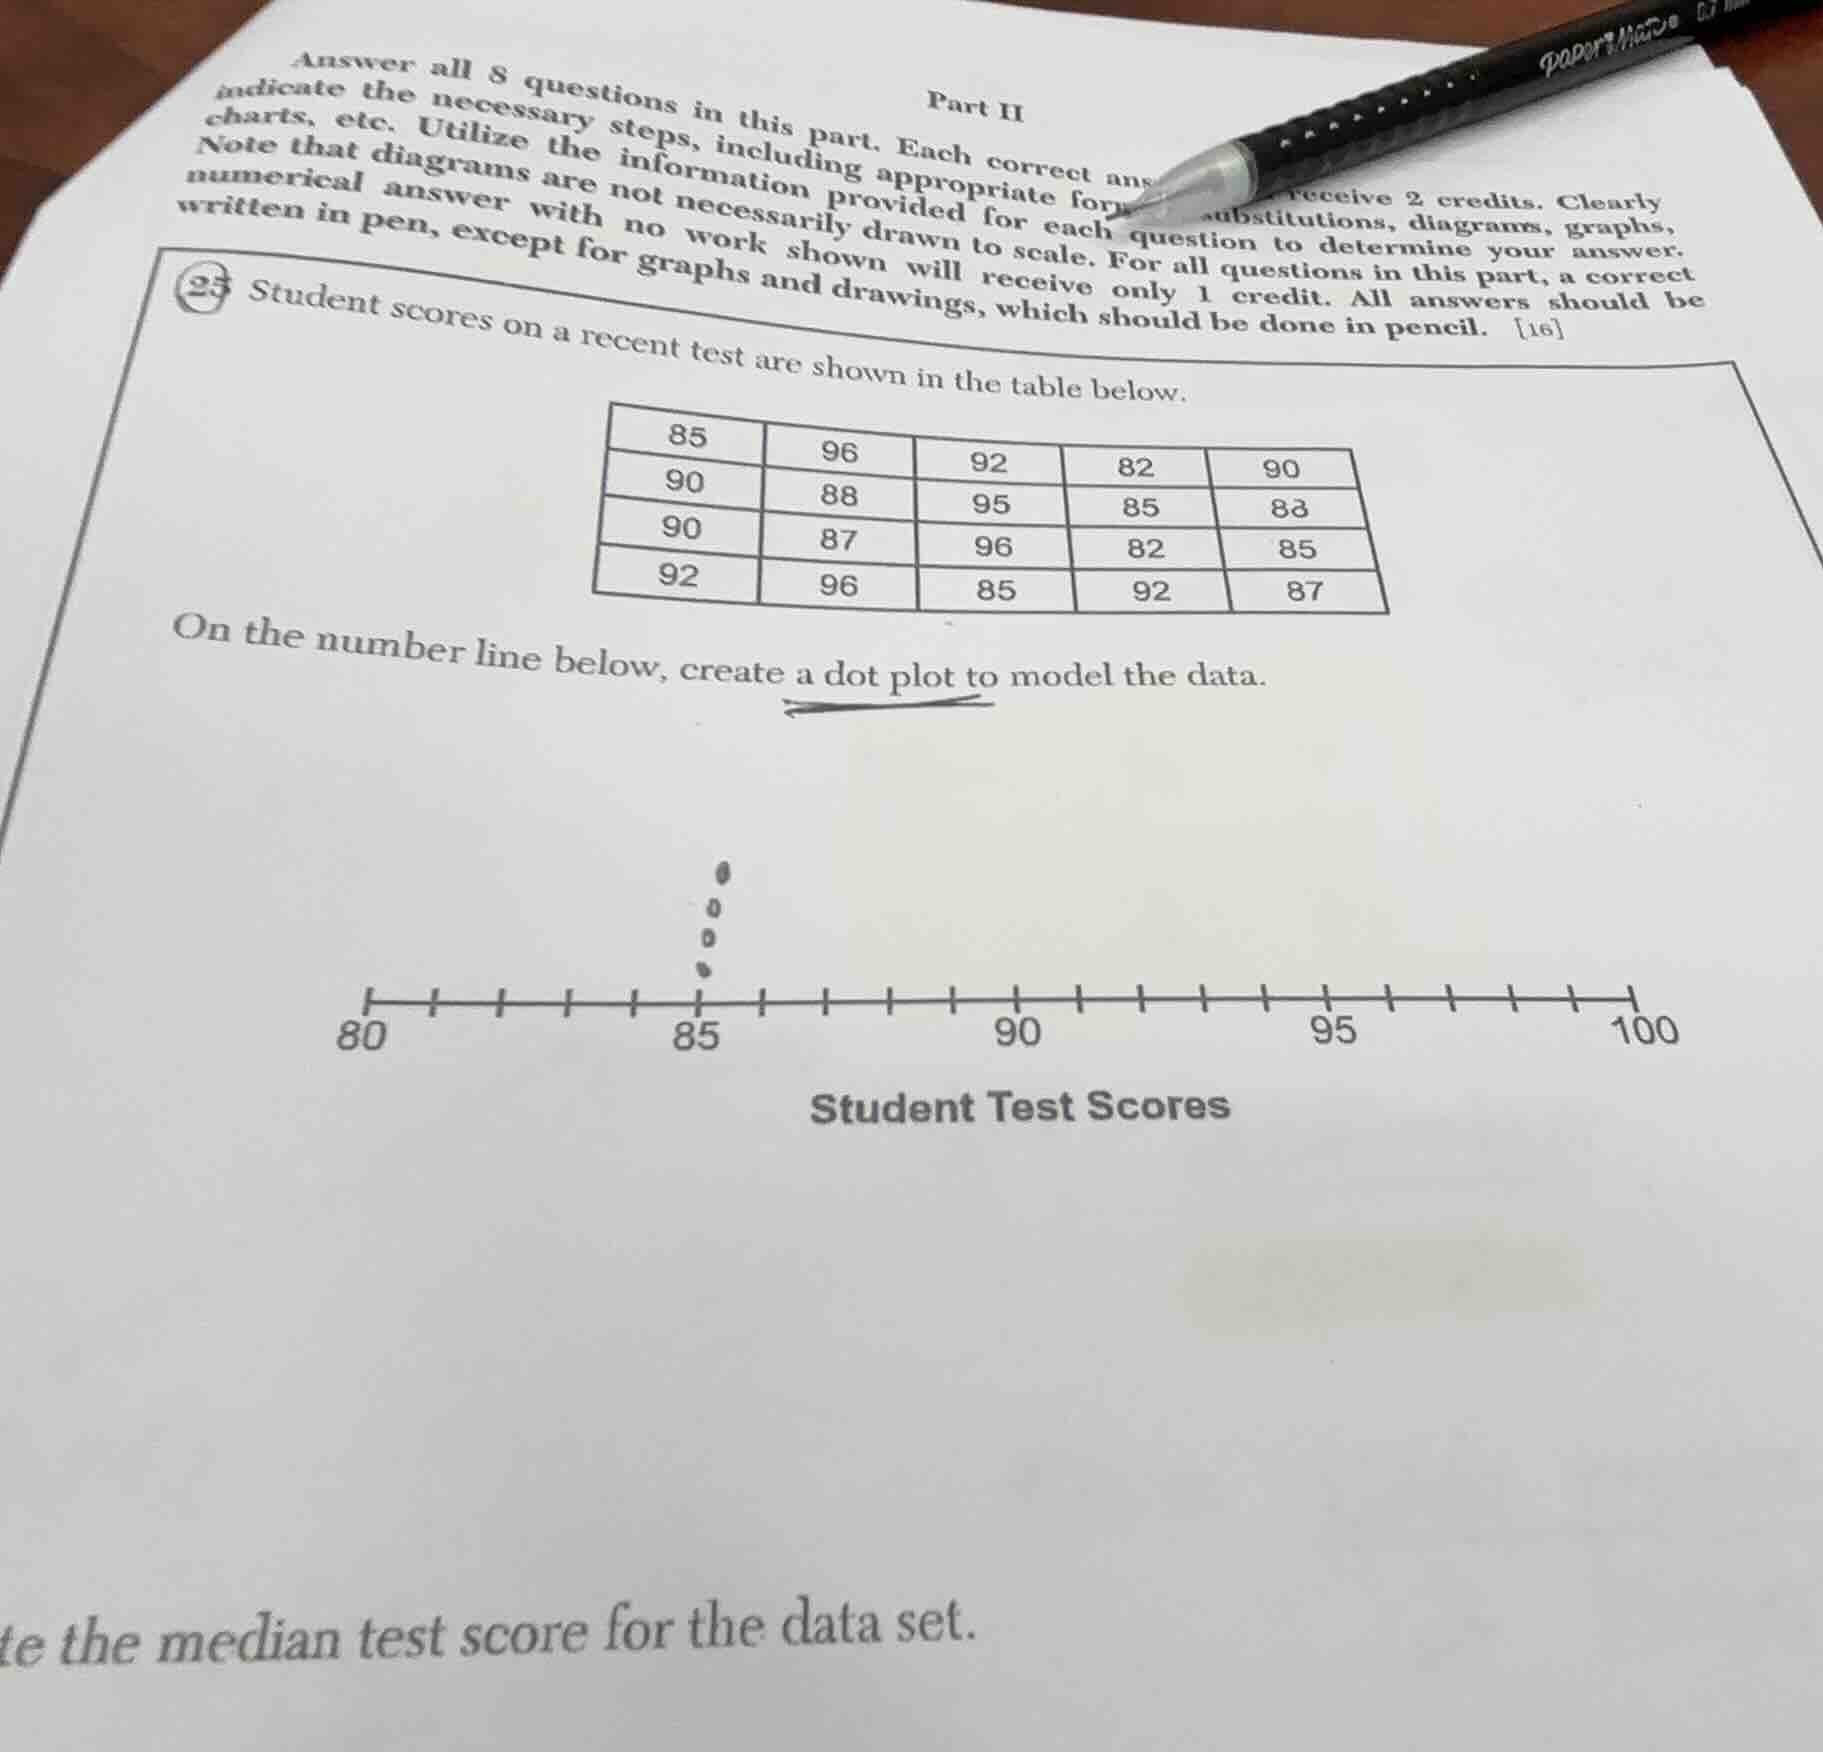
23 student scores on a recent test are shown in the table below.
85 96 92 82 90
90 88 95 85 88
90 87 96 82 85
92 96 85 92 87
on the number line below, create a dot plot to model the data.
student test scores
the median test score for the data set.
Step1: List all scores
82, 82, 85, 85, 85, 85, 87, 87, 88, 90, 90, 90, 90, 92, 92, 92, 95, 96, 96, 96
Step2: Count total data points
$n=20$ (even number)
Step3: Find median positions
Median = average of $\frac{n}{2}$th and $(\frac{n}{2}+1)$th values:
$\frac{20}{2}=10$, $\frac{20}{2}+1=11$
Step4: Get values & calculate median
10th value = 90, 11th value = 90
$\text{Median} = \frac{90+90}{2}=90$
Step5: Tally scores for dot plot
- 82: 2 dots
- 85: 4 dots
- 87: 2 dots
- 88: 1 dot
- 90: 4 dots
- 92: 3 dots
- 95: 1 dot
- 96: 3 dots

Snap & solve any problem in the app
Get step-by-step solutions on Sovi AI
Photo-based solutions with guided steps
Explore more problems and detailed explanations
Dot Plot:
Student Test Scores
 80  82  84  86  88  90  92  94  96  98 100
    ●●    ●●●●  ●    ●●●●  ●●●    ●    ●●●
Median Test Score:
90