QUESTION IMAGE
Question
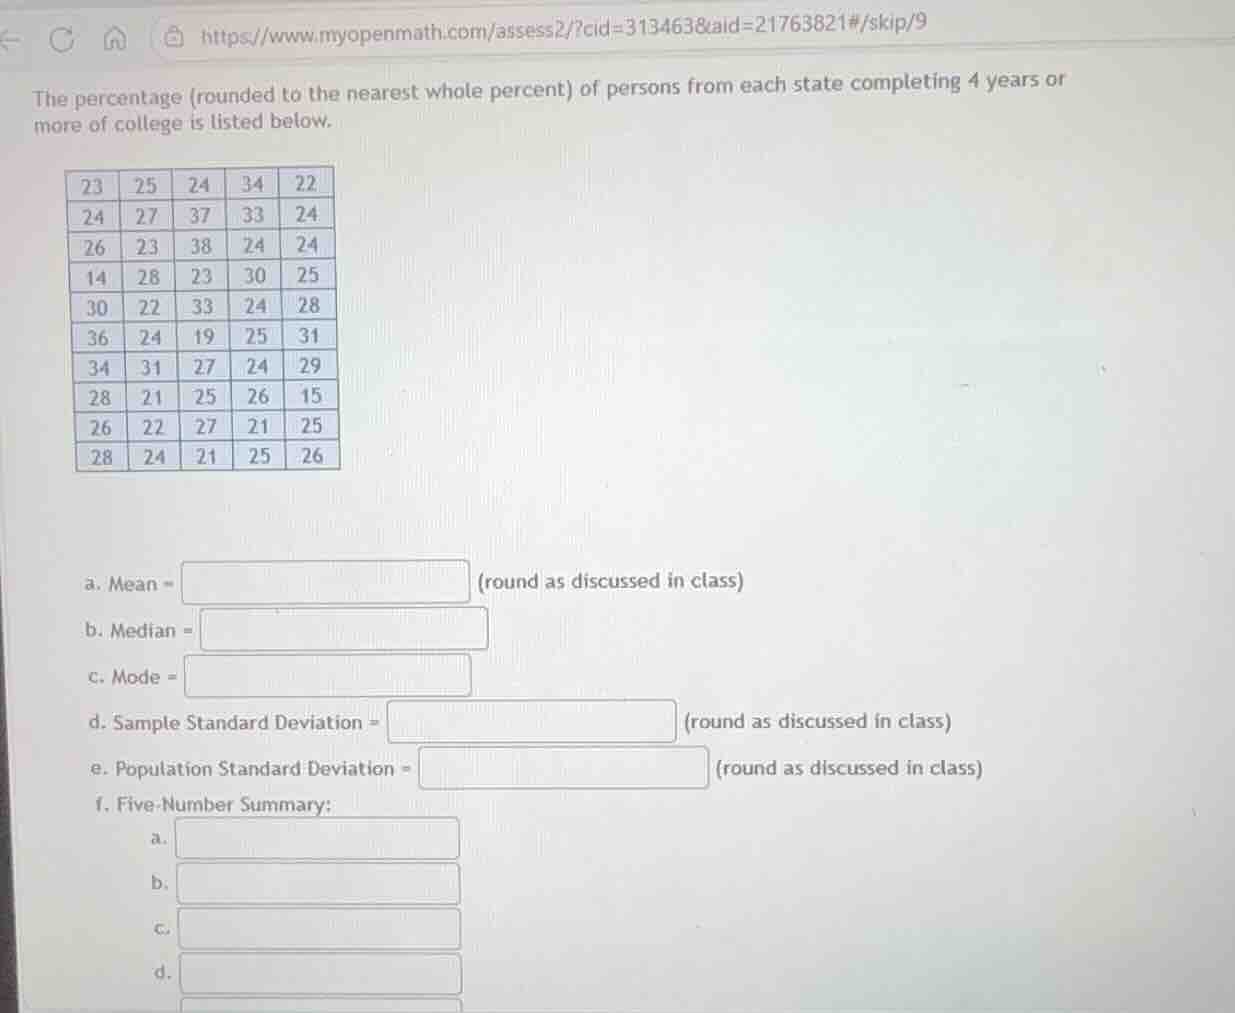
the percentage rounded to the nearest whole percent of persons from each state completing 4 years or more of college is listed below.23 25 24 34 2224 27 37 33 2426 23 38 24 2414 28 23 30 2530 22 33 24 2836 24 19 25 3134 31 27 24 2928 21 25 26 1526 22 27 21 2528 24 21 25 26a. mean = round as discussed in classb. median =c. mode =d. sample standard deviation = round as discussed in classe. population standard deviation = round as discussed in classf. five-number summary:a.b.c.d.
Step1: Count total data points
There are 10 rows × 5 columns = 50 data points.
Step2: Calculate the sum of all values
Add all the numbers:
$23+25+24+34+22+24+27+37+33+24+26+23+38+24+24+14+28+23+30+25+30+22+33+24+28+36+24+19+25+31+34+31+27+24+29+28+21+25+26+15+26+22+27+21+25+28+24+21+25+26 = 1265$
Step3: Compute the mean
Mean = $\frac{\text{Total Sum}}{\text{Number of Data Points}}$
$\text{Mean} = \frac{1265}{50} = 25.3$
Step4: Order data to find median
Sort all 50 values from smallest to largest:
14, 15, 19, 21, 21, 21, 22, 22, 22, 23, 23, 23, 24, 24, 24, 24, 24, 24, 24, 24, 25, 25, 25, 25, 25, 25, 26, 26, 26, 26, 27, 27, 27, 28, 28, 28, 28, 29, 30, 30, 31, 31, 33, 33, 34, 34, 36, 37, 38
For even $n=50$, median = $\frac{\text{25th value} + \text{26th value}}{2}$
$\text{Median} = \frac{25 + 25}{2} = 25$
Step5: Identify the mode
The value that appears most frequently is 24 (appears 8 times).
Step6: Calculate sample standard deviation
First, compute squared differences from the mean for each value, sum them:
$\sum (x_i - \bar{x})^2 = (14-25.3)^2 + (15-25.3)^2 + ... + (38-25.3)^2 = 1685.5$
Sample standard deviation $s = \sqrt{\frac{\sum (x_i - \bar{x})^2}{n-1}}$
$s = \sqrt{\frac{1685.5}{49}} \approx \sqrt{34.4} \approx 5.87$
Step7: Calculate population standard deviation
Population standard deviation $\sigma = \sqrt{\frac{\sum (x_i - \bar{x})^2}{n}}$
$\sigma = \sqrt{\frac{1685.5}{50}} = \sqrt{33.71} \approx 5.81$
Step8: Find five-number summary
- Minimum: Smallest value = 14
- First Quartile (Q1): Median of first 25 values = 23
- Median (Q2): Already found = 25
- Third Quartile (Q3): Median of last 25 values = 28
- Maximum: Largest value = 38

Snap & solve any problem in the app
Get step-by-step solutions on Sovi AI
Photo-based solutions with guided steps
Explore more problems and detailed explanations
a. Mean = 25.3
b. Median = 25
c. Mode = 24
d. Sample Standard Deviation ≈ 5.87
e. Population Standard Deviation ≈ 5.81
f. Five-Number Summary:
a. Minimum = 14
b. First Quartile (Q1) = 23
c. Median (Q2) = 25
d. Third Quartile (Q3) = 28
e. Maximum = 38