QUESTION IMAGE
Question
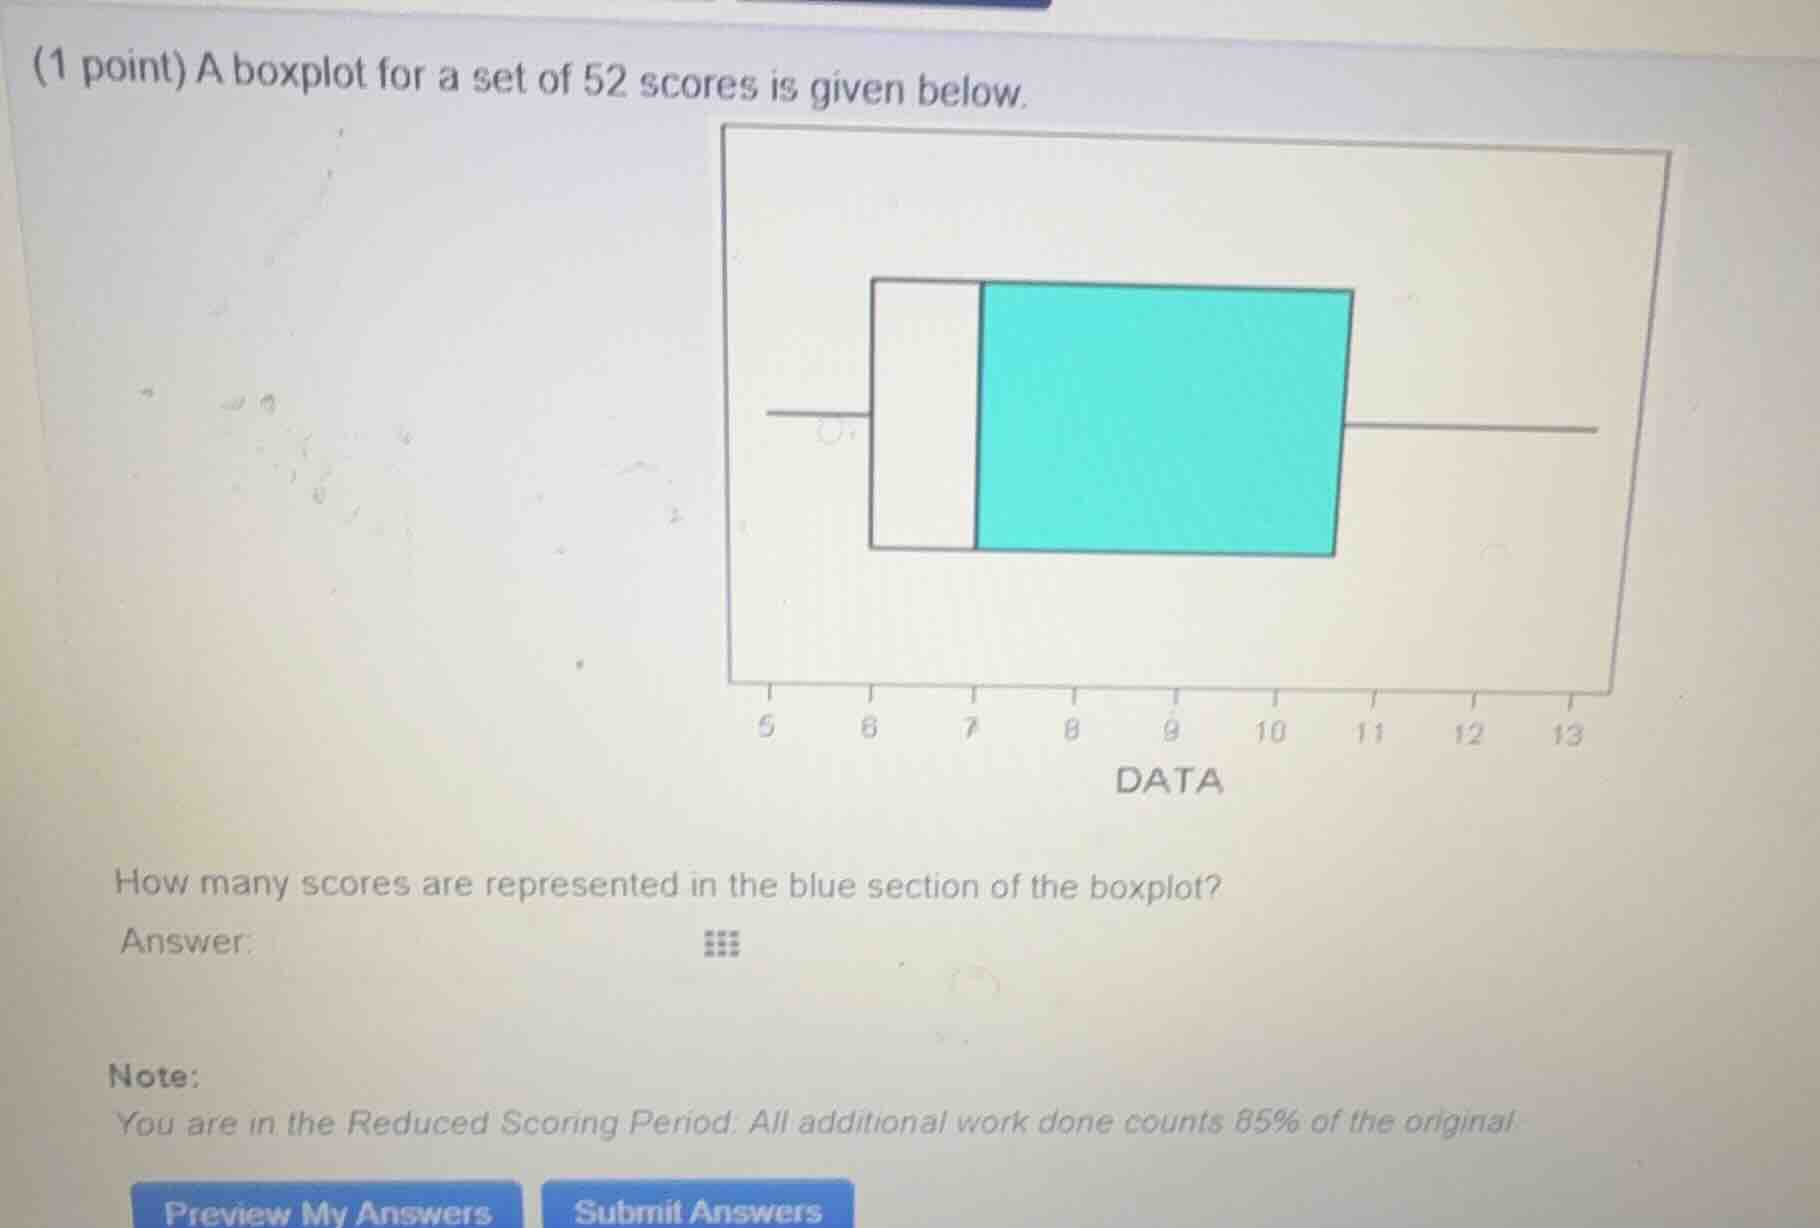
(1 point) a boxplot for a set of 52 scores is given below. how many scores are represented in the blue section of the boxplot? answer: note: you are in the reduced scoring period. all additional work done counts 85% of the original
Step1: Recall boxplot quartiles
A boxplot has 50% of data in the box (between \(Q_1\) and \(Q_3\)). The blue section here is likely half the box (since the box is split, so 25% to 50%? Wait, no—wait, total data is 52. Wait, the box represents the interquartile range (IQR), which is 50% of the data? No, IQR is the middle 50% (from \(Q_1\) to \(Q_3\), so 25th to 75th percentile). Wait, the blue section: looking at the box, if the box is split, maybe the blue part is from the median to \(Q_3\)? Wait, no—wait, the total number of scores is 52. Let's think: in a boxplot, the box contains 50% of the data? No, IQR is 50% (25th to 75th percentile). Wait, maybe the blue section is half of the box? Wait, no—wait, the total data is 52. Let's calculate: the box has 50% of the data? No, IQR is 50% (so 25th to 75th percentile, so 50% of the data). Wait, but the box is split into two parts (white and blue). So each part would be 25% of the data? Wait, no—wait, the median splits the data into two halves (50% below, 50% above). Wait, the box is from \(Q_1\) to \(Q_3\) (50% of data). The median is inside the box, splitting the box into two parts: each part has 25% of the total data. Wait, total data is 52. So 25% of 52 is \(0.25 \times 52 = 13\)? No, wait—wait, the box has 50% of the data (from \(Q_1\) to \(Q_3\)). If the box is split into two equal parts (white and blue), then each part has 25% of the total data? Wait, no—wait, the median is the middle value. For 52 data points, the median is the average of the 26th and 27th values. The box (IQR) is from \(Q_1\) (13th value) to \(Q_3\) (39th value). So the box contains data from 13th to 39th, which is 26 values (50% of 52). If the box is split into two parts (white and blue), each part would have 13 values (25% of 52). Wait, but the blue section—maybe the blue part is from the median to \(Q_3\)? Wait, the median is at the 26th value. So from median (26th) to \(Q_3\) (39th) is 13 values. Wait, 52 total scores. Let's calculate: 52 divided by 4 (since quartiles are 25% each). 52 / 4 = 13. So each quartile has 13 scores. The blue section: if the box is from \(Q_1\) to \(Q_3\) (50% of data, 26 scores), and the blue part is from the median to \(Q_3\), that's 25% of the total data (13 scores). Wait, no—wait, the box is \(Q_1\) to \(Q_3\) (50% of data: 26 scores). If the box is split into two equal parts (white and blue), each part is 13 scores (25% of total). So the blue section has 13 scores? Wait, no—wait, maybe I messed up. Wait, total data: 52. The box (IQR) has 50% of the data (26 scores). The blue part: looking at the box, the white part is from \(Q_1\) to median, and blue from median to \(Q_3\). So each part is 25% of the total data (13 scores). Wait, 52 0.25 = 13? Wait, 52 0.5 = 26 (IQR). Then median splits IQR into two 13-score parts. So blue section: 13? Wait, no—wait, 52 divided by 4 is 13. So each quartile (25%) is 13 scores. So from median (50th percentile) to \(Q_3\) (75th percentile) is 25% of the data, which is 13 scores? Wait, no—wait, 50th to 75th percentile is 25% of the data, so 52 0.25 = 13. Yes. So the blue section, being from median to \(Q_3\), has 13 scores? Wait, but wait—maybe the blue section is the upper half of the box (from median to \(Q_3\)), which is 25% of the total data. So 52 0.25 = 13? Wait, no—wait, the box is 50% (26 scores). If the box is split into two, each is 13 scores. So blue section: 13? Wait, no—wait, let's check again. Total data: 52. The box (IQR) contains 50% of the data (26 scores). The median is the middle of the data, so 26th score. So from \(Q_…

Snap & solve any problem in the app
Get step-by-step solutions on Sovi AI
Photo-based solutions with guided steps
Explore more problems and detailed explanations
13