QUESTION IMAGE
Question
- 1 / 1 points
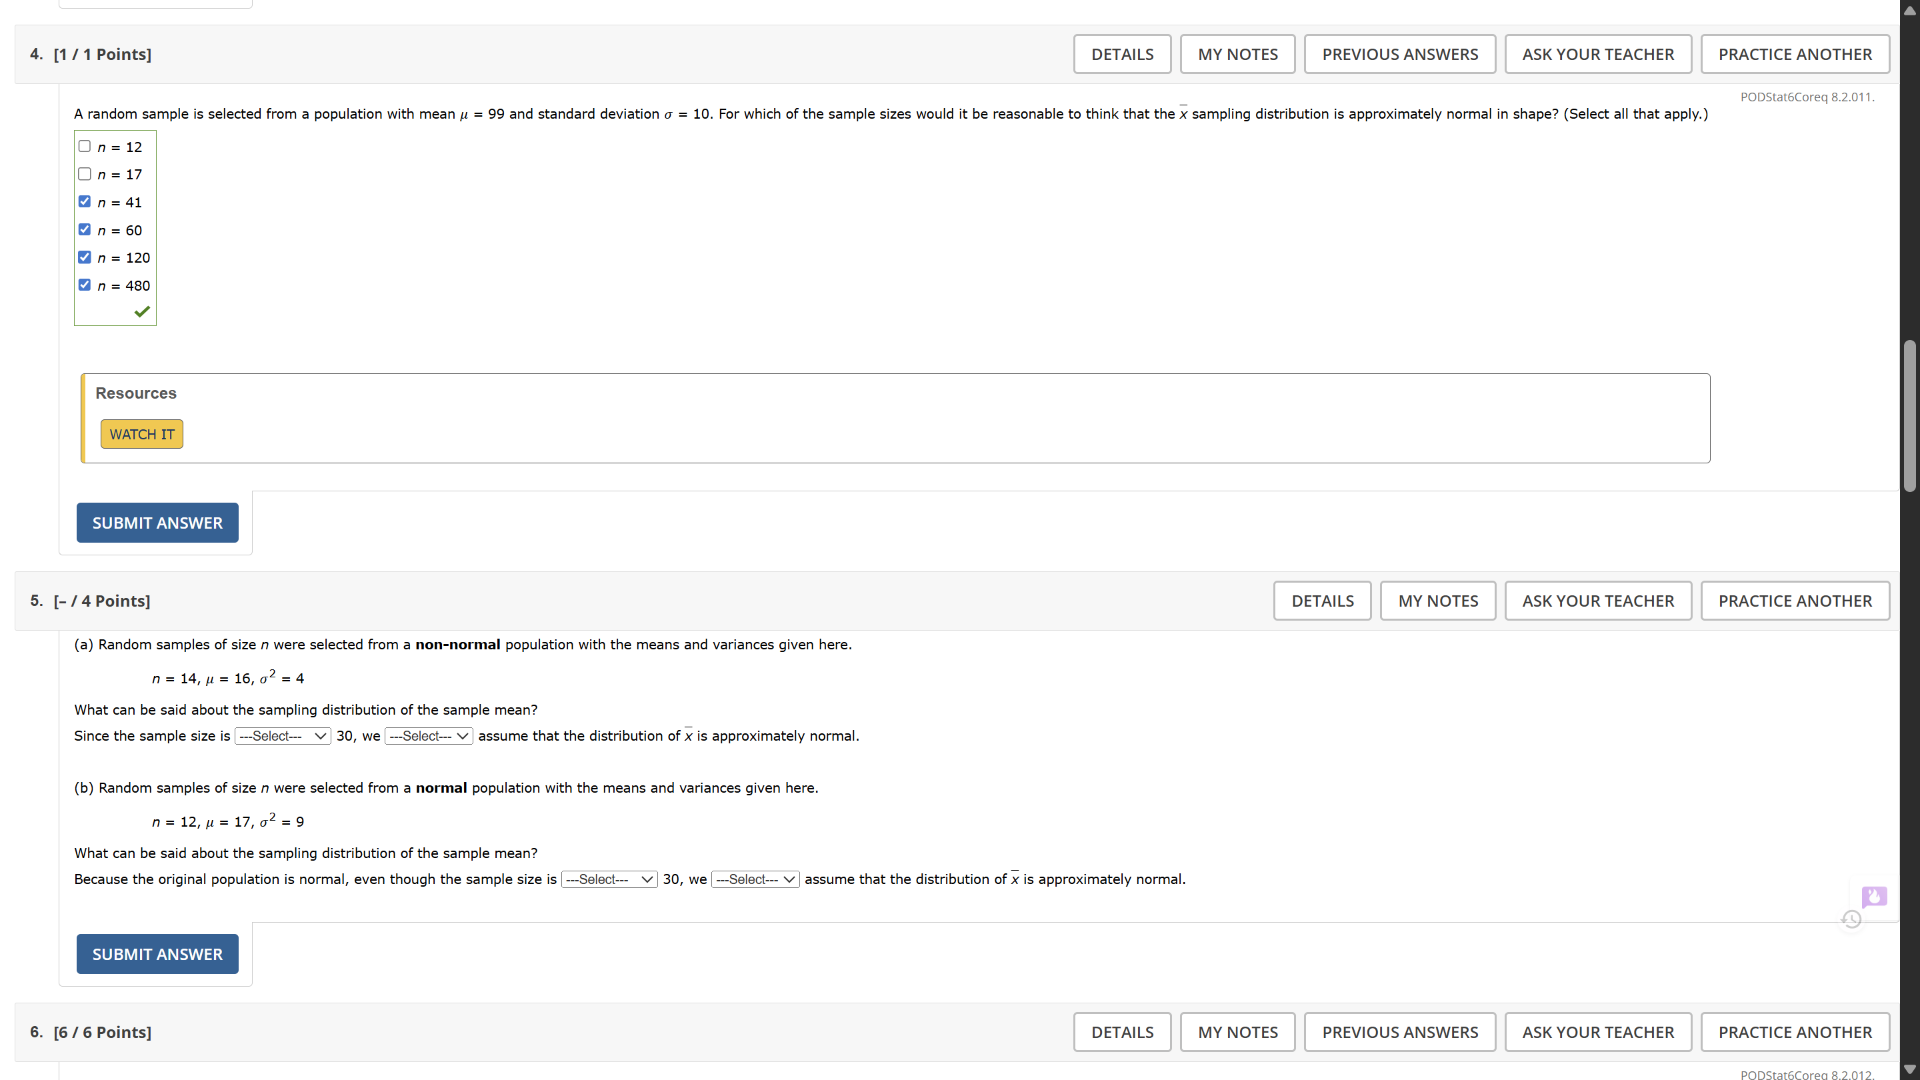
a random sample is selected from a population with mean \\( \mu = 99 \\) and standard deviation \\( \sigma = 10 \\). for which of the sample sizes would it be reasonable to think that the \\( \bar{x} \\) sampling distribution is approximately normal in shape? (select all that apply.)
\\( n = 12 \\)
\\( n = 17 \\)
\\( n = 41 \\)
\\( n = 60 \\)
\\( n = 120 \\)
\\( n = 480 \\)
resources
watch it
submit answer
- - / 4 points
(a) random samples of size \\( n \\) were selected from a non - normal population with the means and variances given here.
\\( n = 14, \mu = 16, \sigma^2 = 4 \\)
what can be said about the sampling distribution of the sample mean?
since the sample size is \\( \text{---select---} \\) 30, we \\( \text{---select---} \\) assume that the distribution of \\( \bar{x} \\) is approximately normal.
(b) random samples of size \\( n \\) were selected from a normal population with the means and variances given here.
\\( n = 12, \mu = 17, \sigma^2 = 9 \\)
what can be said about the sampling distribution of the sample mean?
because the original population is normal, even though the sample size is \\( \text{---select---} \\) 30, we \\( \text{---select---} \\) assume that the distribution of \\( \bar{x} \\) is approximately normal.
submit answer
- 6 / 6 points
Question 4
To determine when the sampling distribution of the sample mean \(\bar{x}\) is approximately normal, we use the Central Limit Theorem (CLT). The CLT states that for a population with mean \(\mu\) and standard deviation \(\sigma\), the sampling distribution of the sample mean \(\bar{x}\) becomes approximately normal as the sample size \(n\) increases, regardless of the population distribution (for non - normal populations, a common rule of thumb is \(n\geq30\); if the population is normal, the sampling distribution of \(\bar{x}\) is normal for any \(n\)). But in general, for most cases, when \(n\) is large (usually \(n\geq30\)), the sampling distribution of \(\bar{x}\) is approximately normal.
- For \(n = 12\): \(12<30\), so it is not reasonable to assume the sampling distribution of \(\bar{x}\) is approximately normal.
- For \(n = 17\): \(17<30\), so it is not reasonable to assume the sampling distribution of \(\bar{x}\) is approximately normal.
- For \(n = 41\): \(41\geq30\), so it is reasonable to assume the sampling distribution of \(\bar{x}\) is approximately normal.
- For \(n = 60\): \(60\geq30\), so it is reasonable to assume the sampling distribution of \(\bar{x}\) is approximately normal.
- For \(n = 120\): \(120\geq30\), so it is reasonable to assume the sampling distribution of \(\bar{x}\) is approximately normal.
- For \(n = 480\): \(480\geq30\), so it is reasonable to assume the sampling distribution of \(\bar{x}\) is approximately normal.
Step 1: Analyze the sample size
We are given a non - normal population. The sample size \(n = 14\). We compare \(n = 14\) with \(30\). Since \(14<30\), the sample size is less than \(30\).
Step 2: Determine the assumption
For a non - normal population, when the sample size is less than \(30\), we cannot assume that the distribution of \(\bar{x}\) is approximately normal.
Step 1: Analyze the sample size
We are given a normal population. The sample size \(n = 12\). We compare \(n = 12\) with \(30\). Since \(12<30\), the sample size is less than \(30\).
Step 2: Determine the assumption
For a normal population, the sampling distribution of the sample mean \(\bar{x}\) is normal for any sample size \(n\). So even though the sample size is less than \(30\), we can assume that the distribution of \(\bar{x}\) is approximately normal.

Snap & solve any problem in the app
Get step-by-step solutions on Sovi AI
Photo-based solutions with guided steps
Explore more problems and detailed explanations
\(n = 41\), \(n = 60\), \(n = 120\), \(n = 480\) (the options with these \(n\) values should be selected)