QUESTION IMAGE
Question
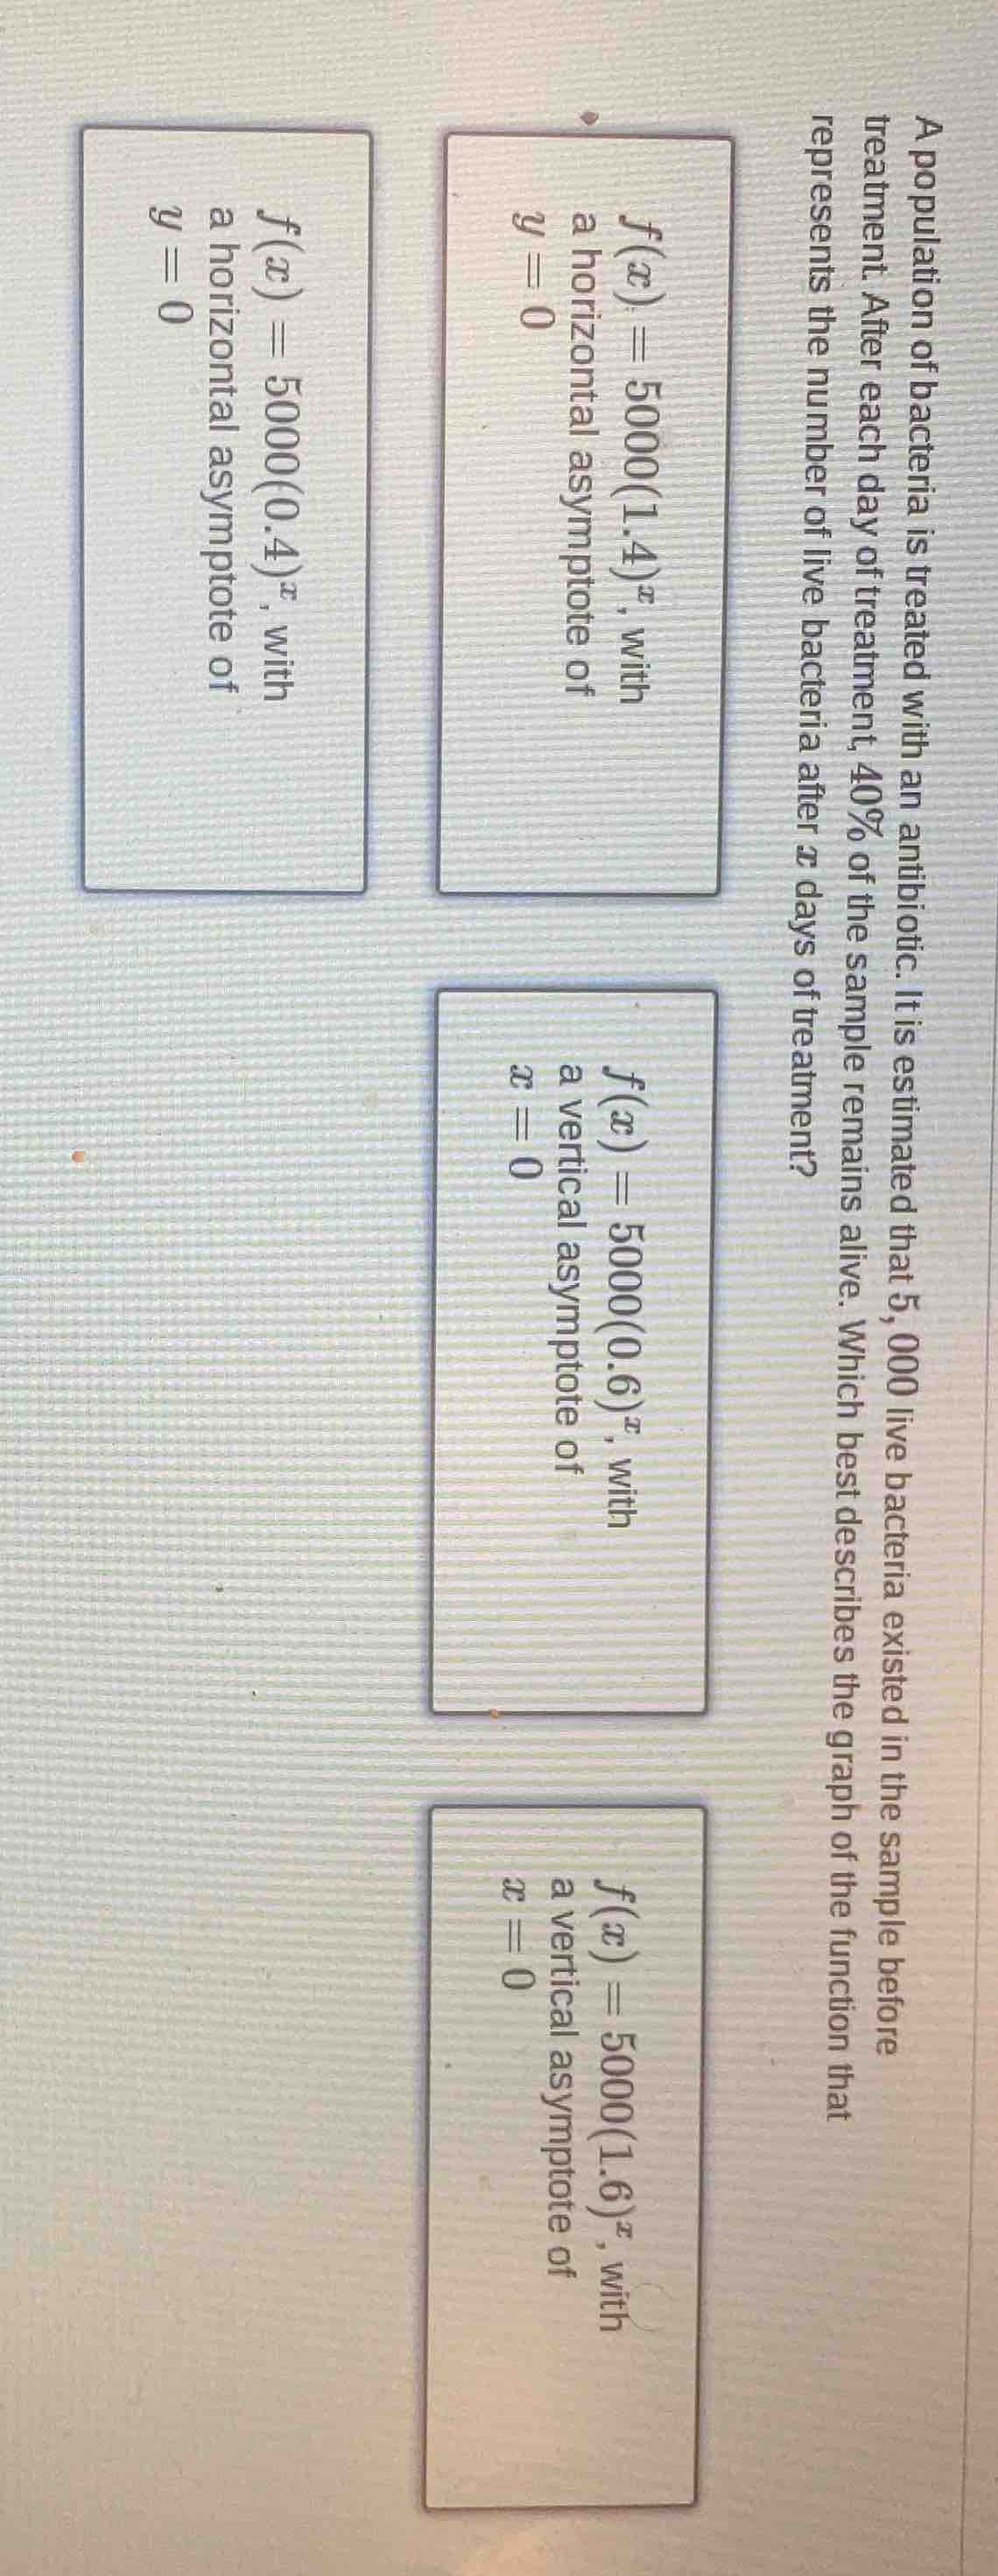
a population of bacteria is treated with an antibiotic. it is estimated that 5,000 live bacteria existed in the sample before treatment. after each day of treatment, 40% of the sample remains alive. which best describes the graph of the function that represents the number of live bacteria after x days of treatment?
$f(x) = 5000(1.4)^x$, with a horizontal asymptote of $y = 0$
$f(x) = 5000(0.4)^x$, with a horizontal asymptote of $y = 0$
$f(x) = 5000(0.6)^x$, with a vertical asymptote of $x = 0$
$f(x) = 5000(1.6)^x$, with a vertical asymptote of $x = 0$
Step1: Identify decay factor
Since 40% of bacteria remain alive each day, the decay factor is $0.4$.
Step2: Define exponential decay function
Initial population is 5000, so the function is $f(x) = 5000(0.4)^x$.
Step3: Find horizontal asymptote
For exponential functions of the form $f(x)=ab^x$ where $0

Snap & solve any problem in the app
Get step-by-step solutions on Sovi AI
Photo-based solutions with guided steps
Explore more problems and detailed explanations
$f(x) = 5000(0.4)^x$, with a horizontal asymptote of $y = 0$