QUESTION IMAGE
26,126 Learners found this answer helpful
Question
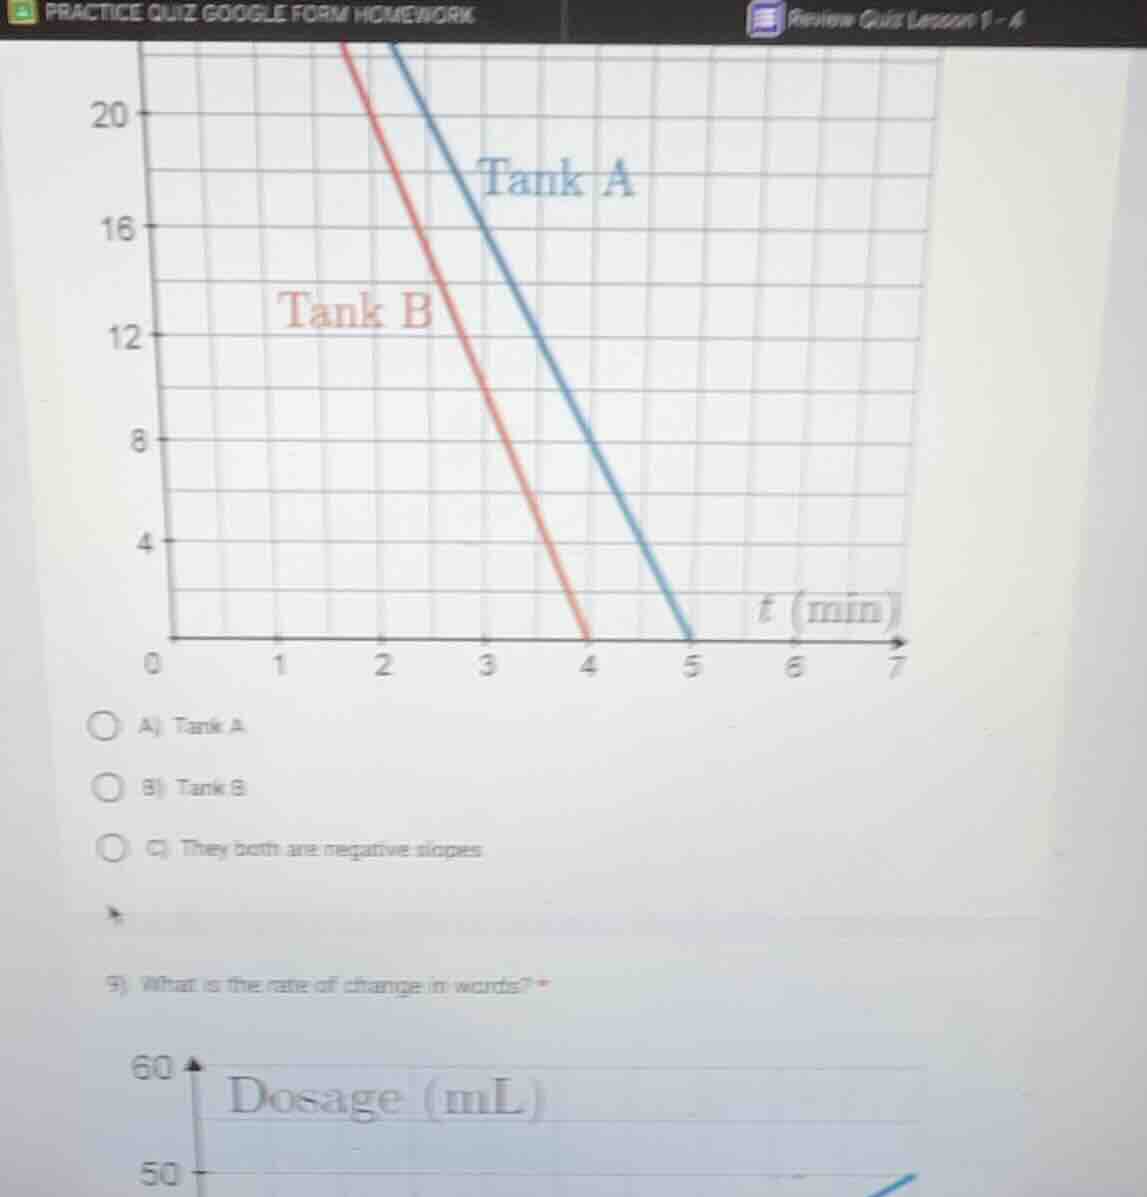
practice quiz google form homework review quiz lesson 1 - 4 (graph of tank a and tank b with t (min) on x - axis and volume on y - axis) a) tank a b) tank b c) they both are negative slopes 9) what is the rate of change in words? (graph with dosage (ml) on y - axis, 50 and 60 marked)
Response
To solve this, we analyze the slopes of the lines for Tank A and Tank B. A negative slope indicates a decrease over time (since as \( t \) (time in minutes) increases, the amount in the tank decreases).
- For Tank A: The line goes from a higher value at \( t = 2 \) (or earlier) to 0 at \( t = 5 \), so it has a negative slope (decreasing).
- For Tank B: The line goes from a higher value at \( t = 2 \) (or earlier) to 0 at \( t = 4 \), so it also has a negative slope (decreasing).

Snap & solve any problem in the app
Get step-by-step solutions on Sovi AI
Photo-based solutions with guided steps
Explore more problems and detailed explanations
C) They both are negative slopes