QUESTION IMAGE
Question
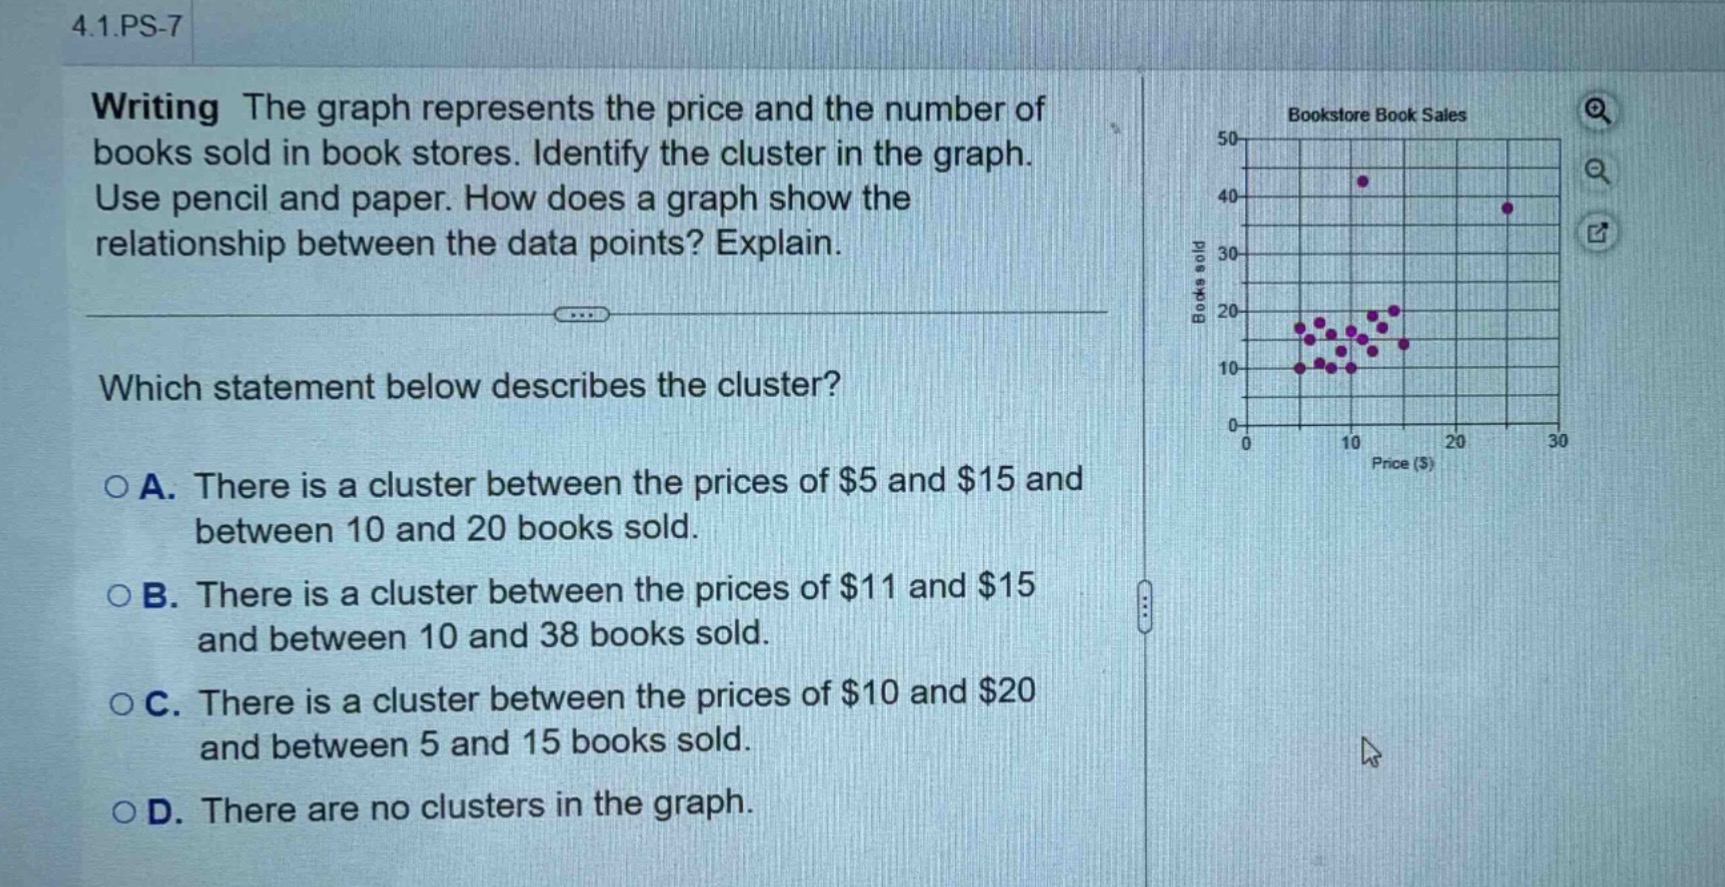
4.1.ps-7
writing the graph represents the price and the number of books sold in book stores. identify the cluster in the graph. use pencil and paper. how does a graph show the relationship between the data points? explain.
which statement below describes the cluster?
a. there is a cluster between the prices of $5 and $15 and between 10 and 20 books sold.
b. there is a cluster between the prices of $11 and $15 and between 10 and 38 books sold.
c. there is a cluster between the prices of $10 and $20 and between 5 and 15 books sold.
d. there are no clusters in the graph.
To identify the cluster, we analyze the graph's data points. A cluster is a group of data points that are close together. Looking at the "Bookstore Book Sales" graph, the majority of points are between prices $5 - $15 (x - axis) and 10 - 20 books sold (y - axis). Option A matches this: it states the cluster is between $5 - $15 (price) and 10 - 20 (books sold). Option B's price range ($11 - $15) is too narrow, Option C's book - sold range (5 - 15) and price range ($10 - $20) don't match the cluster, and Option D is incorrect as there is a cluster.

Snap & solve any problem in the app
Get step-by-step solutions on Sovi AI
Photo-based solutions with guided steps
Explore more problems and detailed explanations
A. There is a cluster between the prices of $5 and $15 and between 10 and 20 books sold.