QUESTION IMAGE
Question
question 1 of 10
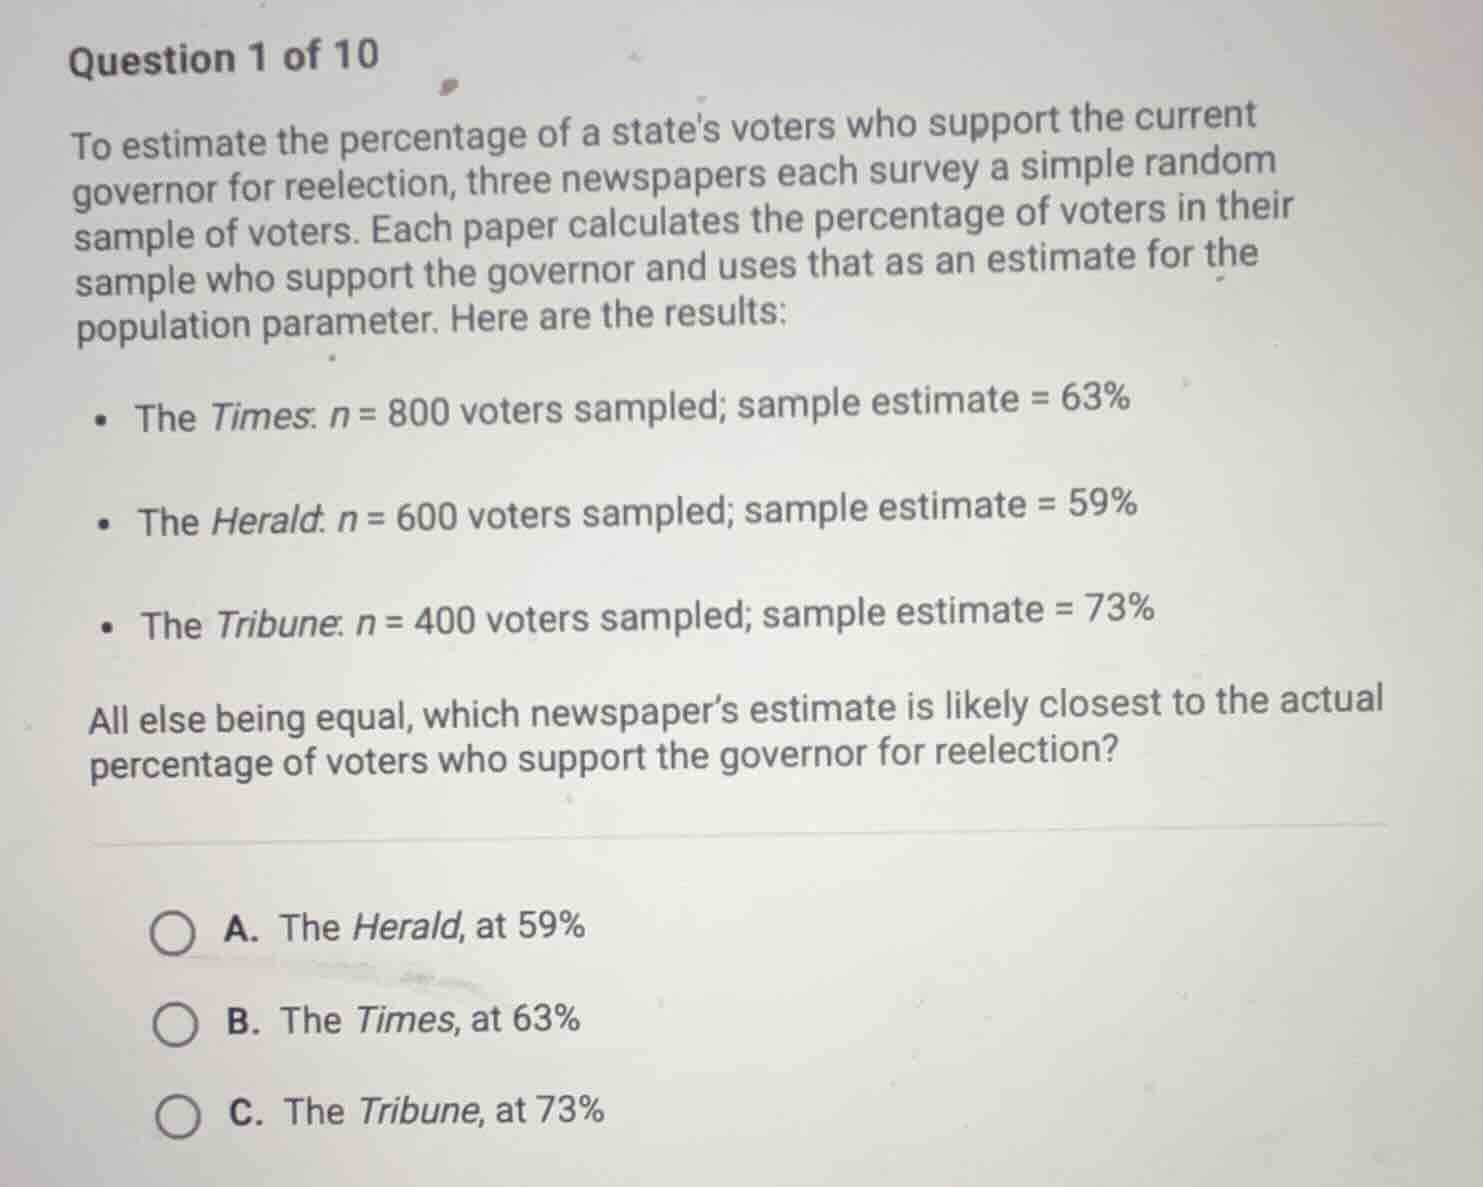
to estimate the percentage of a states voters who support the current
governor for reelection, three newspapers each survey a simple random
sample of voters. each paper calculates the percentage of voters in their
sample who support the governor and uses that as an estimate for the
population parameter. here are the results:
- the times: ( n = 800 ) voters sampled; sample estimate = 63%
- the herald: ( n = 600 ) voters sampled; sample estimate = 59%
- the tribune: ( n = 400 ) voters sampled; sample estimate = 73%
all else being equal, which newspaper’s estimate is likely closest to the actual
percentage of voters who support the governor for reelection?
a. the herald, at 59%
b. the times, at 63%
c. the tribune, at 73%
Step1: Recall sampling variability rule
Larger sample size reduces sampling error, so larger samples produce estimates closer to the true population parameter, all else equal.
Step2: Compare sample sizes
Sample sizes: The Times ($n=800$), The Herald ($n=600$), The Tribune ($n=400$). $800 > 600 > 400$, so The Times has the largest sample.

Snap & solve any problem in the app
Get step-by-step solutions on Sovi AI
Photo-based solutions with guided steps
Explore more problems and detailed explanations
B. The Times, at 63%