QUESTION IMAGE
Question
question 34 of 40
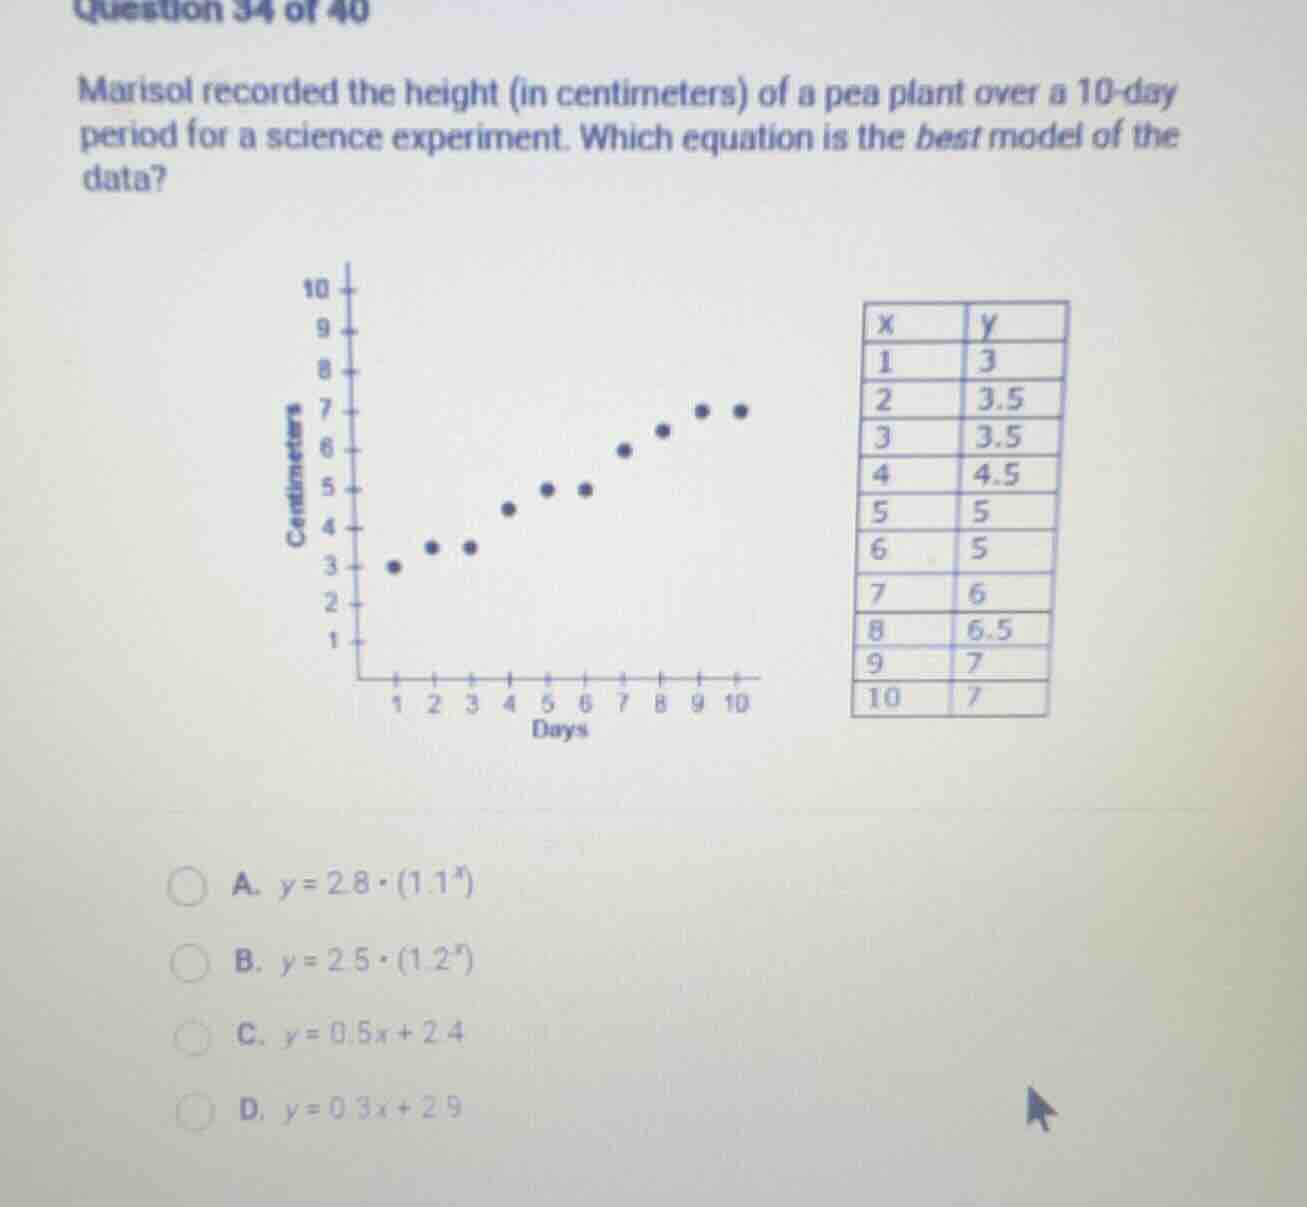
marisol recorded the height (in centimeters) of a pea plant over a 10-day period for a science experiment. which equation is the best model of the data?
a. $y=2.8 \cdot (1.1^x)$
b. $y=2.5 \cdot (1.2^x)$
c. $y=0.5x+2.4$
d. $y=0.3x+2.9$
Step1: Test linear model C
For $x=1$: $y=0.5(1)+2.4=2.9 \approx 3$
For $x=10$: $y=0.5(10)+2.4=7.4$ (close to 7)
Calculate average error:
$x=2$: $0.5(2)+2.4=3.4 \approx 3.5$
$x=3$: $0.5(3)+2.4=3.9$ (diff 0.4 from 3.5)
$x=4$: $0.5(4)+2.4=4.4 \approx 4.5$
$x=5$: $0.5(5)+2.4=4.9 \approx 5$
$x=6$: $0.5(6)+2.4=5.4$ (diff 0.4 from 5)
$x=7$: $0.5(7)+2.4=5.9 \approx 6$
$x=8$: $0.5(8)+2.4=6.4 \approx 6.5$
$x=9$: $0.5(9)+2.4=6.9 \approx 7$
Step2: Test linear model D
For $x=1$: $y=0.3(1)+2.9=3.2$ (diff 0.2 from 3)
For $x=10$: $y=0.3(10)+2.9=5.9$ (diff 1.1 from 7)
$x=7$: $0.3(7)+2.9=5$ (diff 1 from 6)
Larger errors overall.
Step3: Test exponential model A
For $x=1$: $y=2.8(1.1^1)=3.08 \approx 3$
For $x=10$: $y=2.8(1.1^{10}) \approx 2.8(2.5937)=7.26$
$x=5$: $2.8(1.1^5) \approx 2.8(1.6105)=4.51$ (diff 0.49 from 5)
$x=7$: $2.8(1.1^7) \approx 2.8(1.9487)=5.46$ (diff 0.54 from 6)
Step4: Test exponential model B
For $x=1$: $y=2.5(1.2^1)=3$
For $x=10$: $y=2.5(1.2^{10}) \approx 2.5(6.1917)=15.48$ (far from 7)
Overgrows the data drastically.
Step5: Compare model fits
Model C has the smallest average deviation from the data points; the linear trend matches the scatter plot's steady, linear growth, while exponential models either overpredict (B) or have larger mid-range errors (A), and model D underpredicts later values.

Snap & solve any problem in the app
Get step-by-step solutions on Sovi AI
Photo-based solutions with guided steps
Explore more problems and detailed explanations
C. $y=0.5x+2.4$