QUESTION IMAGE
Question
question
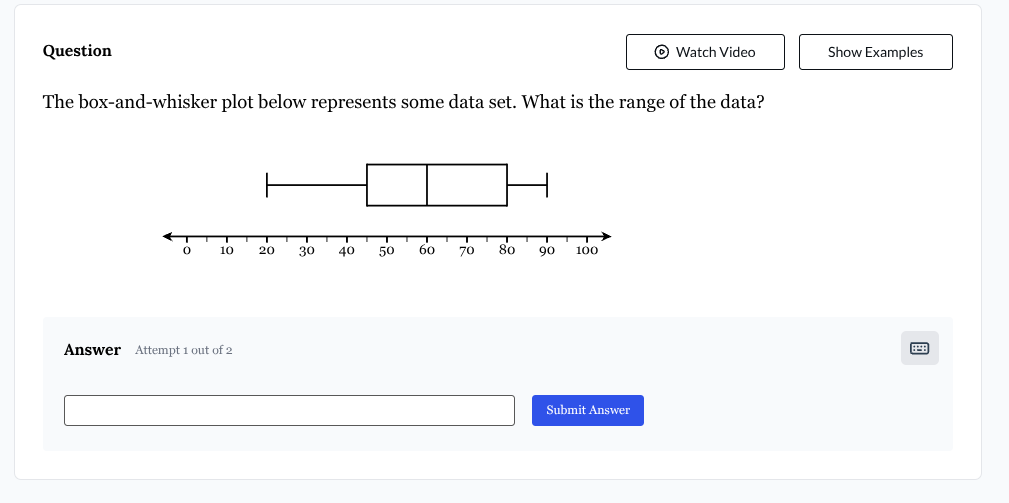
the box - and - whisker plot below represents some data set. what is the range of the data?
answer attempt 1 out of 2
Step1: Identify Min and Max
From the box - and - whisker plot, the minimum value (left whisker end) is 20 and the maximum value (right whisker end) is 90.
Step2: Calculate Range
The formula for the range of a data set is \( \text{Range}=\text{Maximum}-\text{Minimum} \).
Substitute the values: \( \text{Range}=90 - 20=70 \).

Snap & solve any problem in the app
Get step-by-step solutions on Sovi AI
Photo-based solutions with guided steps
Explore more problems and detailed explanations
70