QUESTION IMAGE
Question
question
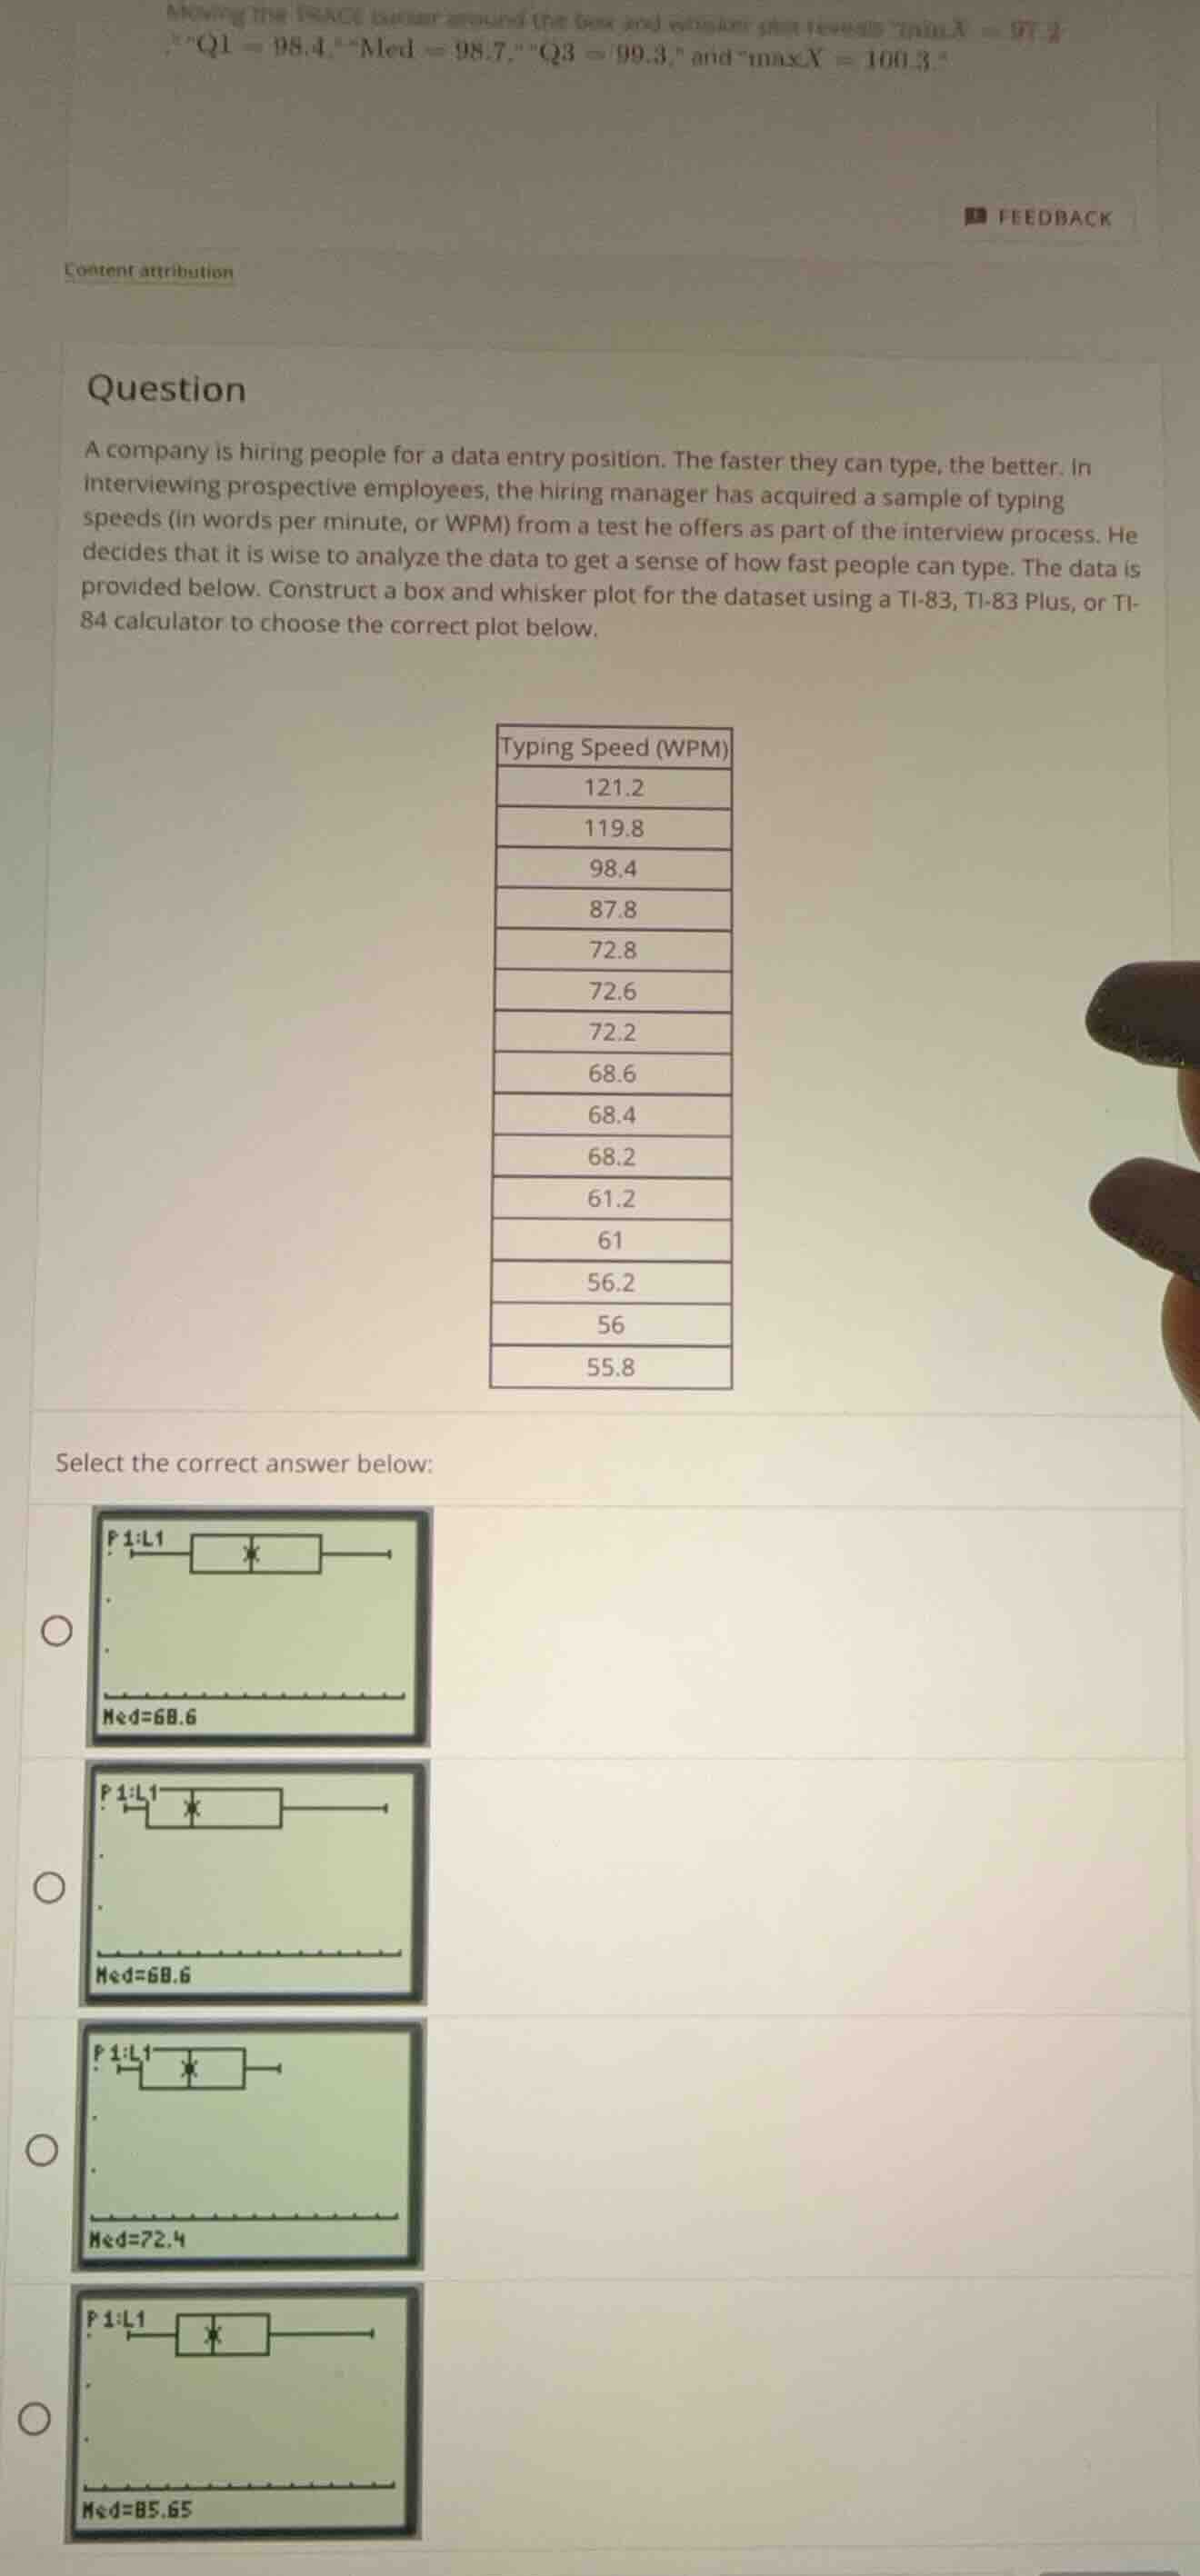
a company is hiring people for a data entry position. the faster they can type, the better. in interviewing prospective employees, the hiring manager has acquired a sample of typing speeds (in words per minute, or wpm) from a test he offers as part of the interview process. he decides that it is wise to analyze the data to get a sense of how fast people can type. the data is provided below. construct a box and whisker plot for the dataset using a ti - 83, ti - 83 plus, or ti - 84 calculator to choose the correct plot below.
typing speed (wpm)
121.2
119.8
98.4
87.8
72.8
72.6
72.2
68.6
68.4
68.2
61.2
61
56.2
56
55.8
select the correct answer below:
Step1: Order the data
First, we order the data set from smallest to largest: \( 55.8, 56, 56.2, 61, 61.2, 68.2, 68.4, 68.6, 72.2, 72.6, 72.8, 87.8, 98.4, 119.8, 121.2 \)
Step2: Find the median (Med)
The number of data points \( n = 15 \), which is odd. The median is the middle value, at position \( \frac{n + 1}{2}=\frac{15+1}{2} = 8 \). The 8th value is \( 68.6 \), so \( \text{Med} = 68.6 \). This eliminates the option with \( \text{Med} = 72.4 \) and \( \text{Med} = 85.65 \).
Step3: Find Q1 (first quartile)
Q1 is the median of the lower half of the data. The lower half is the first 7 values: \( 55.8, 56, 56.2, 61, 61.2, 68.2, 68.4 \). The number of values here is 7 (odd), so the median is at position \( \frac{7 + 1}{2}=4 \). The 4th value is \( 61 \), so \( \text{Q1} = 61 \).
Step4: Find Q3 (third quartile)
Q3 is the median of the upper half of the data. The upper half is the last 7 values: \( 72.2, 72.6, 72.8, 87.8, 98.4, 119.8, 121.2 \). The number of values here is 7 (odd), so the median is at position \( \frac{7 + 1}{2}=4 \). The 4th value is \( 87.8 \), so \( \text{Q3} = 87.8 \).
Step5: Analyze the box - and - whisker plot features
- The median line should be at \( 68.6 \).
- The left whisker should extend from the minimum (\( 55.8 \)) to Q1 (\( 61 \)).
- The right whisker should extend from Q3 (\( 87.8 \)) to the maximum (\( 121.2 \)).
Looking at the remaining options (with \( \text{Med} = 68.6 \)):
- The first option has a box that does not match the Q1 and Q3 we calculated.
- The second option has a left whisker consistent with Q1 = 61 (the left part of the box starts near 61) and the median at 68.6, and the right whisker extending to the higher values, which is consistent with our calculations.

Snap & solve any problem in the app
Get step-by-step solutions on Sovi AI
Photo-based solutions with guided steps
Explore more problems and detailed explanations
The correct box - and - whisker plot is the second option (the one with \( \text{Med} = 68.6 \) and the left whisker corresponding to Q1 = 61). (The option with the circle next to the plot labeled "Med = 68.6" and the left whisker starting around 61)