QUESTION IMAGE
Question
question
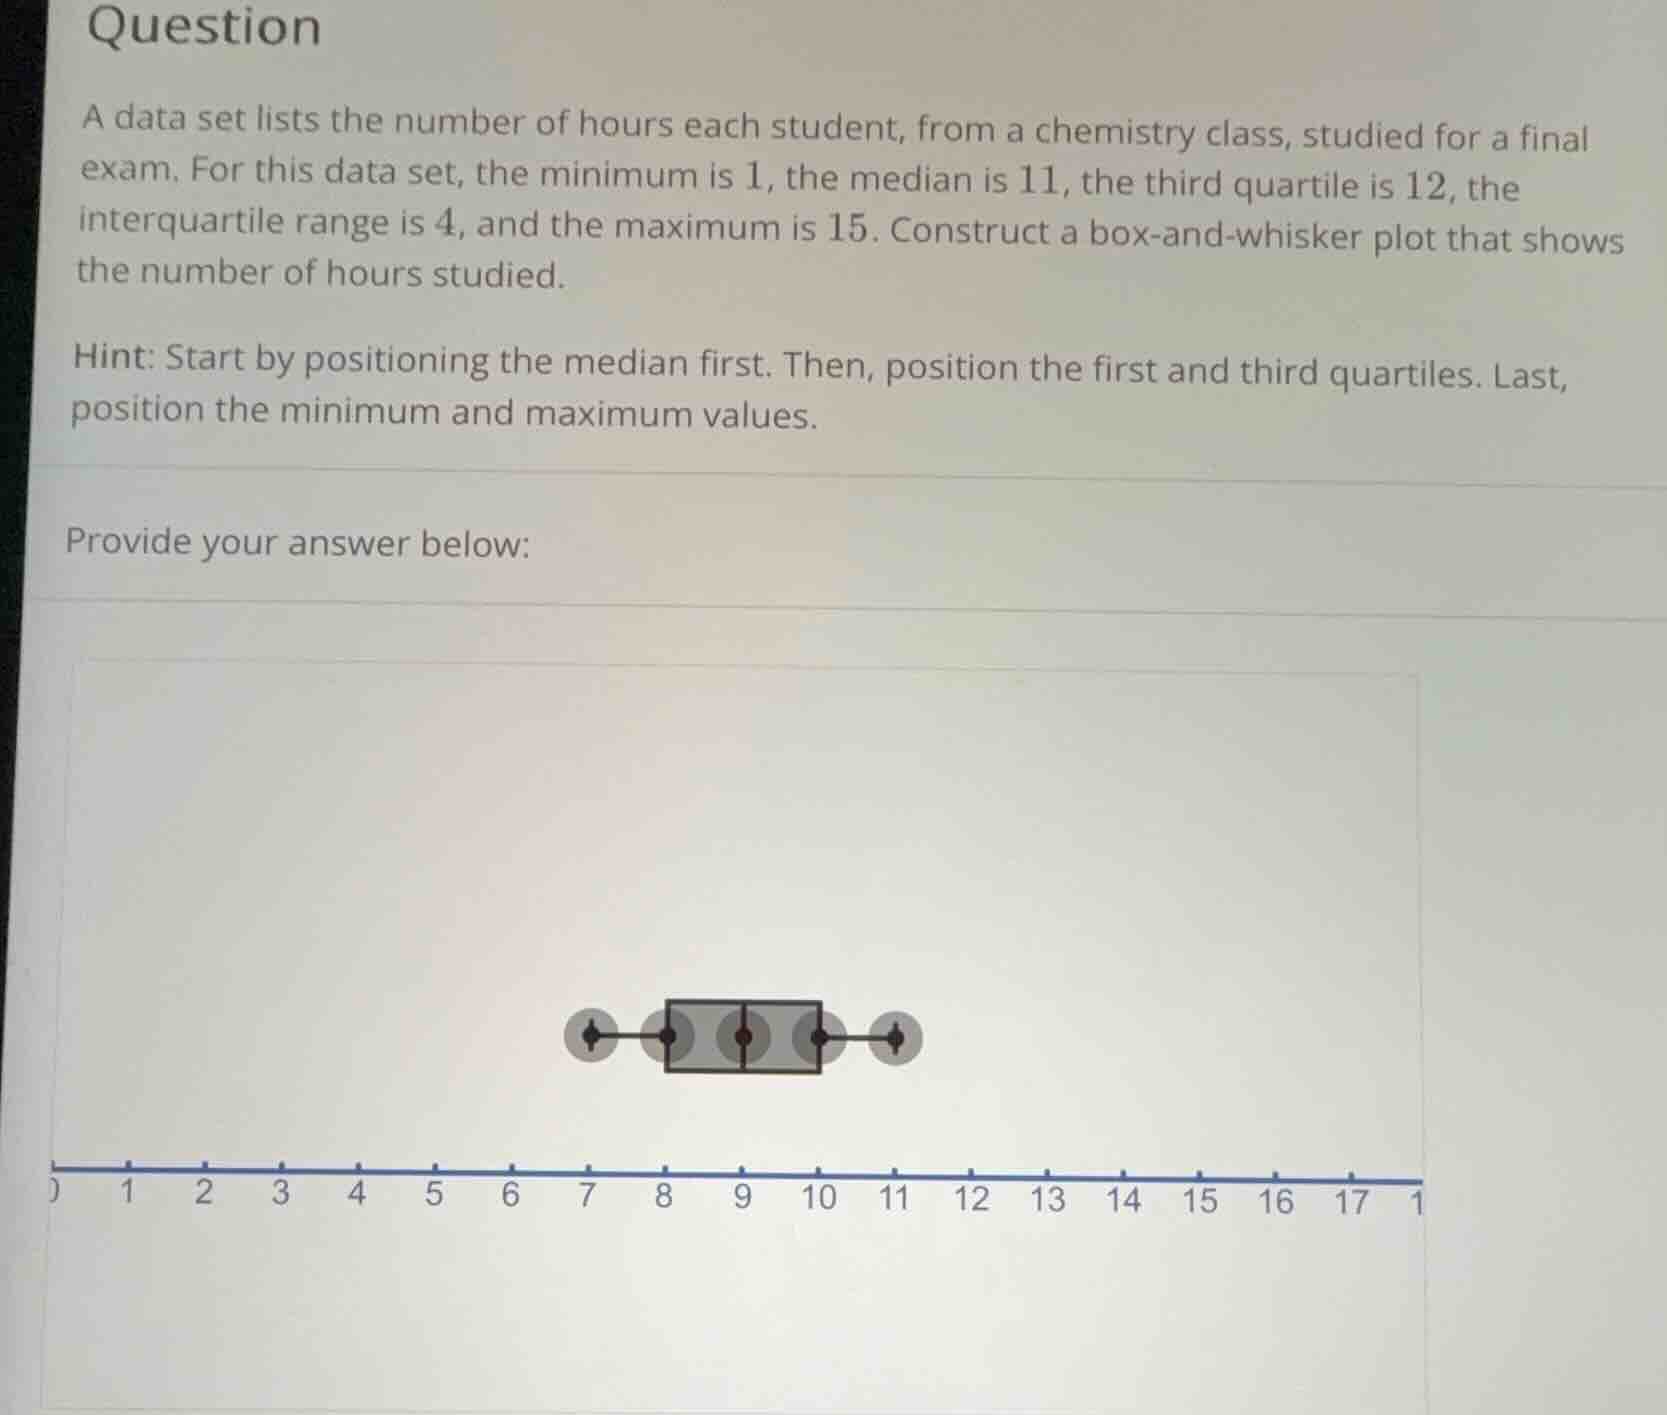
a data set lists the number of hours each student, from a chemistry class, studied for a final exam. for this data set, the minimum is 1, the median is 11, the third quartile is 12, the interquartile range is 4, and the maximum is 15. construct a box - and - whisker plot that shows the number of hours studied.
hint: start by positioning the median first. then, position the first and third quartiles. last, position the minimum and maximum values.
provide your answer below:
Step1: Find the first quartile (Q1)
The interquartile range (IQR) is \( Q3 - Q1 \). We know \( Q3 = 12 \) and \( IQR = 4 \), so \( Q1 = Q3 - IQR = 12 - 4 = 8 \).
Step2: Identify the five - number summary
The five - number summary for a box - and - whisker plot consists of the minimum, \( Q1 \), median, \( Q3 \), and maximum. From the problem, minimum \( = 1 \), \( Q1 = 8 \), median \( = 11 \), \( Q3 = 12 \), maximum \( = 15 \).
Step3: Construct the box - and - whisker plot
- Draw a number line that includes the values from the minimum (1) to the maximum (15).
- Plot the minimum value (1) as the left - most whisker point.
- Plot \( Q1 = 8 \) as the left - hand side of the box.
- Plot the median \( = 11 \) as the line inside the box.
- Plot \( Q3 = 12 \) as the right - hand side of the box.
- Plot the maximum value (15) as the right - most whisker point.
- Draw a box connecting \( Q1 \) and \( Q3 \), and draw whiskers from the box to the minimum and maximum values.

Snap & solve any problem in the app
Get step-by-step solutions on Sovi AI
Photo-based solutions with guided steps
Explore more problems and detailed explanations
The box - and - whisker plot has:
- Minimum (whisker left): 1
- \( Q1 \) (box left): 8
- Median (box line): 11
- \( Q3 \) (box right): 12
- Maximum (whisker right): 15
When plotted on the given number line (ranging from 0 to 17 approximately), the box is between 8 and 12, with a line at 11 inside the box. The left whisker extends from 1 to 8, and the right whisker extends from 12 to 15.