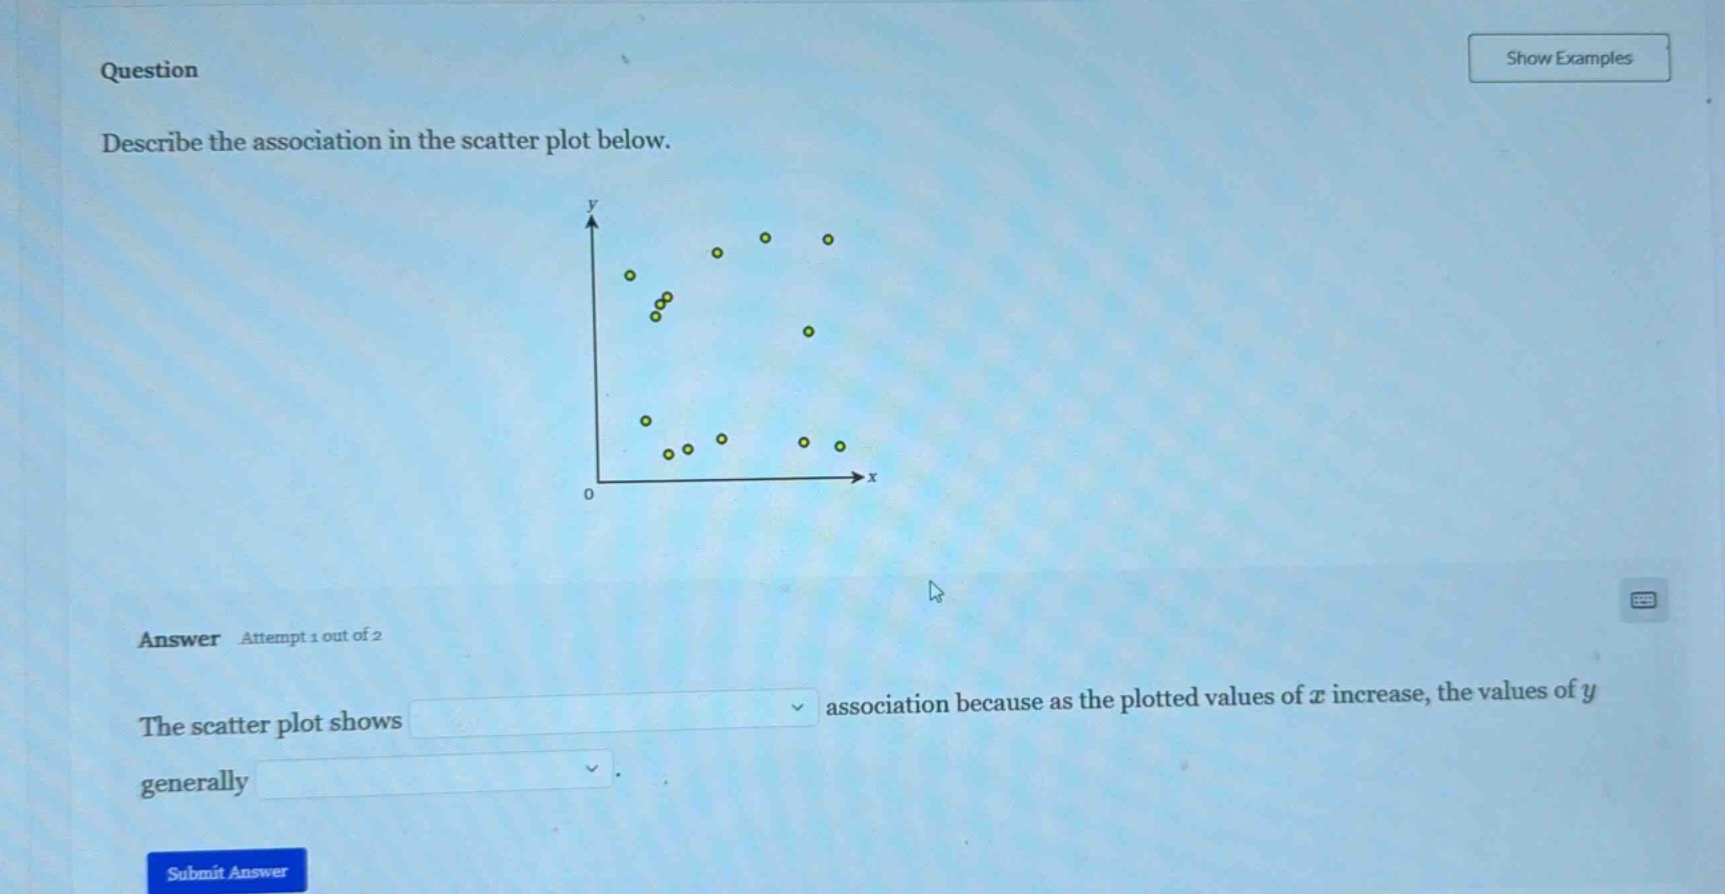
QUESTION IMAGE
Question
question
describe the association in the scatter plot below.
answer attempt 1 out of 2
the scatter plot shows association because as the plotted values of ( x ) increase, the values of ( y ) generally .
submit answer
Brief Explanations
- Direction: As $x$ increases, $y$ tends to increase, so the association is positive.
- Strength: The points are loosely clustered, not tightly following a straight line, so the association is weak.

Snap & solve any problem in the app
Get step-by-step solutions on Sovi AI
Photo-based solutions with guided steps
Explore more problems and detailed explanations
The scatter plot shows a positive, weak association because as the plotted values of $x$ increase, the values of $y$ generally increase.