QUESTION IMAGE
Question
question
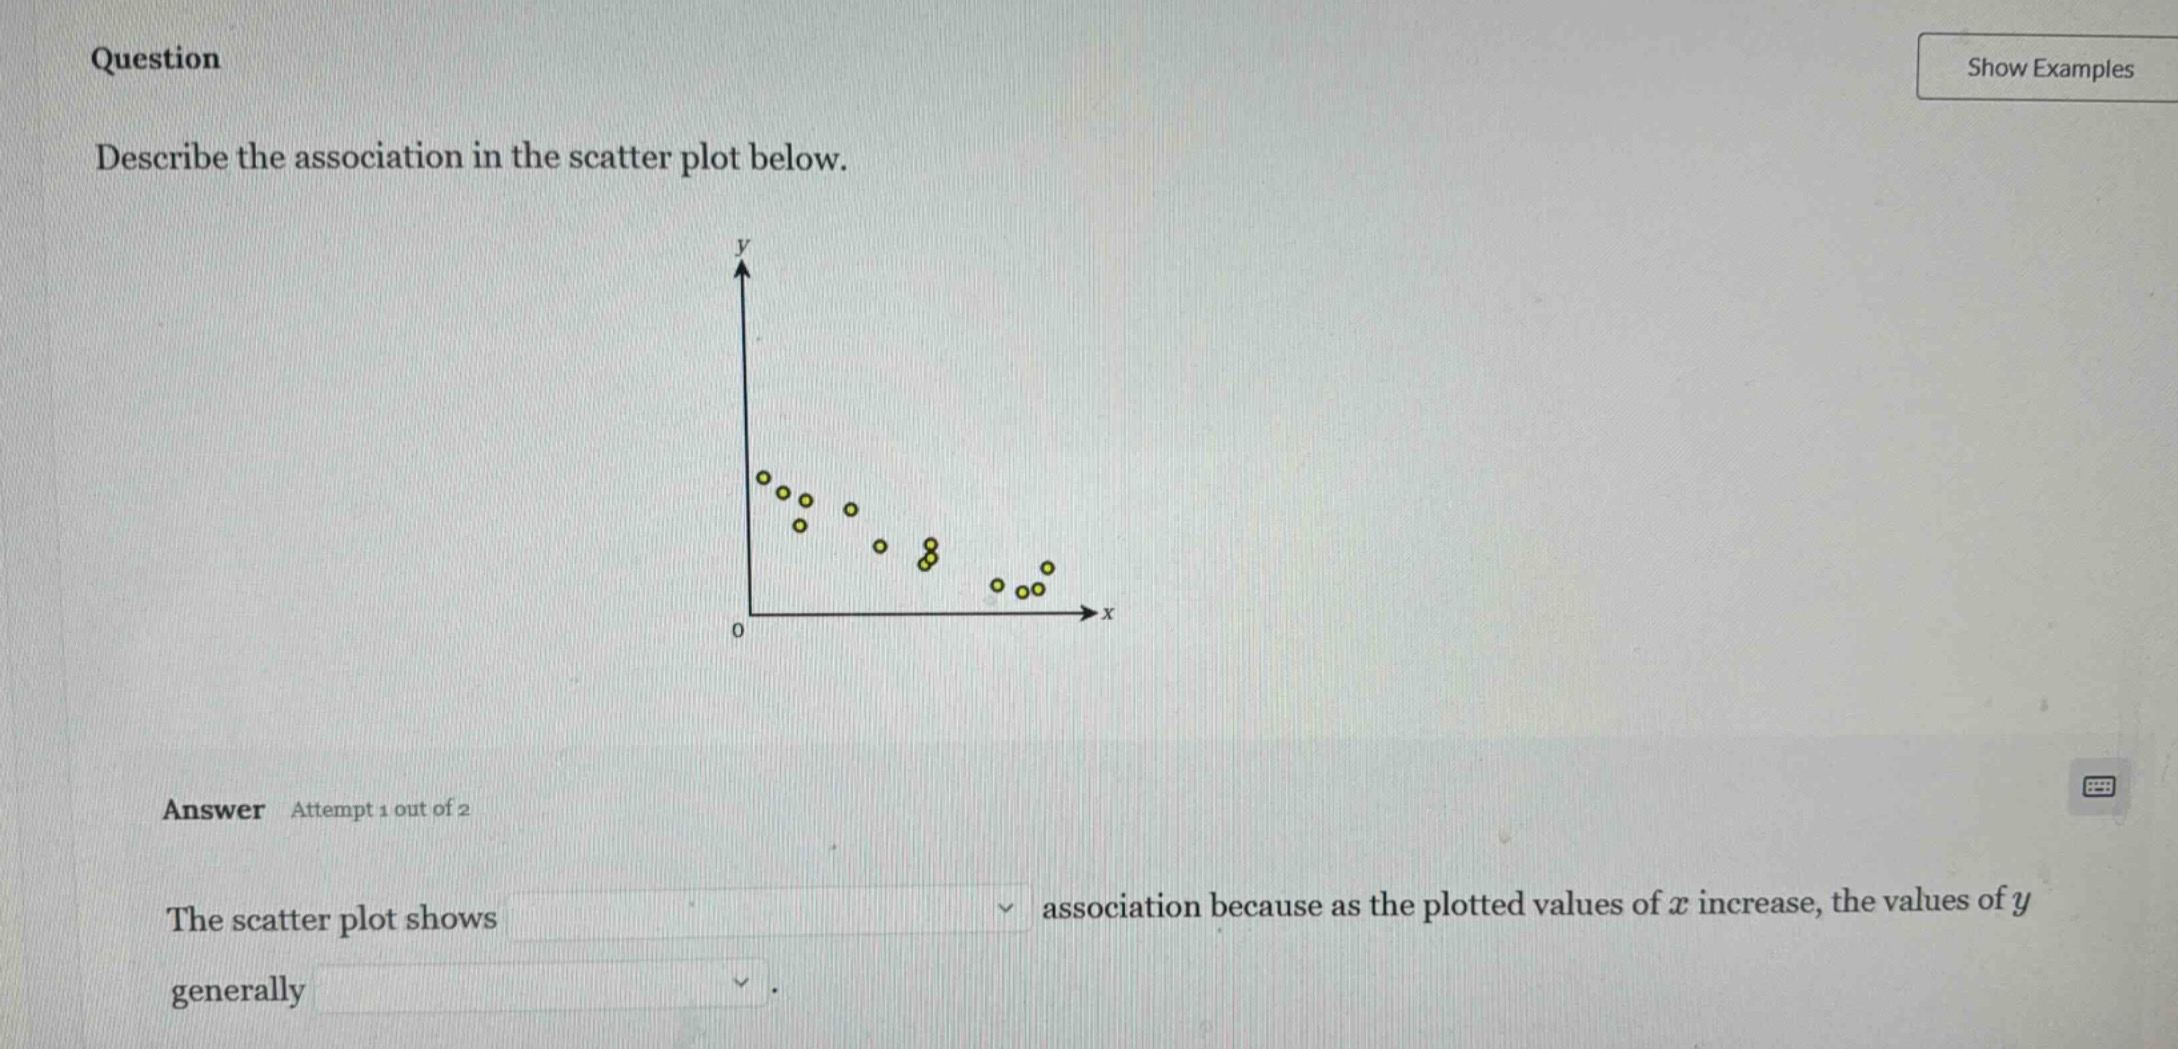
describe the association in the scatter plot below.
answer attempt 1 out of 2
the scatter plot shows
association because as the plotted values of ( x ) increase, the values of ( y ) generally
.
To describe the association in a scatter plot, we analyze the direction (positive/negative) and form (linear/non - linear) of the relationship between the x - values and y - values. Looking at the scatter plot, as the x - values increase, the y - values tend to decrease, and the points seem to follow a somewhat linear trend (even with some scatter). So the association is a negative (and linear, but the first blank is about the type of association directionally, and the second about the change in y with x) association because as x increases, y generally decreases.

Snap & solve any problem in the app
Get step-by-step solutions on Sovi AI
Photo-based solutions with guided steps
Explore more problems and detailed explanations
The scatter plot shows a negative (linear can also be considered but the key directional term here is negative) association because as the plotted values of \( x \) increase, the values of \( y \) generally decrease.
For the first dropdown (type of association): negative (linear is also a valid descriptor for the form, but the main directional association here is negative). For the second dropdown (change in y): decrease.