QUESTION IMAGE
Question
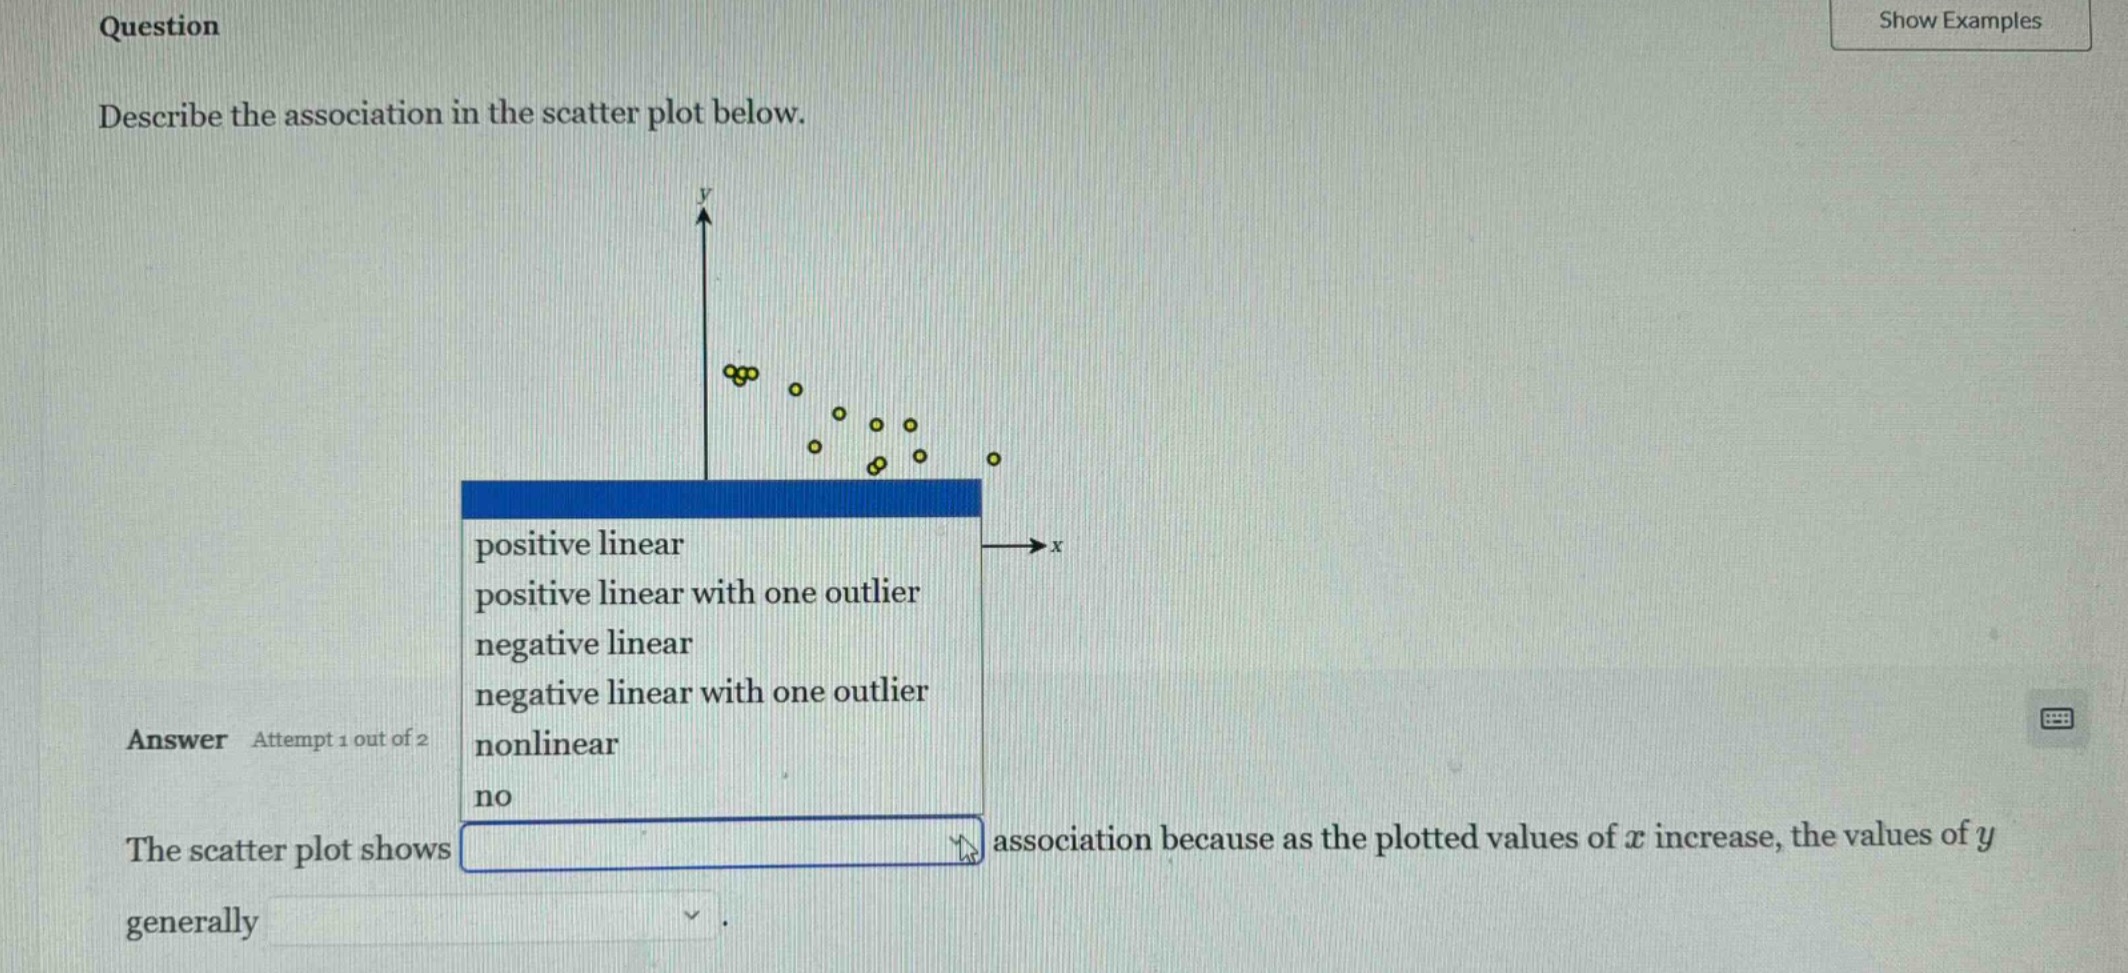
question
describe the association in the scatter plot below.
answer attempt 1 out of 2
the scatter plot shows association because as the plotted values of ( x ) increase, the values of ( y ) generally.
(options: positive linear, positive linear with one outlier, negative linear, negative linear with one outlier, nonlinear, no)
Brief Explanations
To determine the association, we analyze the scatter plot:
- Direction of Association: As \( x \) (the independent variable) increases, we observe the trend of \( y \) (the dependent variable). In a negative linear association, \( y \) values decrease as \( x \) increases.
- Form of Association: The points appear to follow a roughly straight - line pattern (linear), not a curved or random pattern (which would be nonlinear).
- Outliers: There is one point that seems to deviate from the general linear trend of the other points, so we consider if there is an outlier. The overall trend of the non - outlier points is a negative linear trend (as \( x \) increases, \( y \) decreases), and there is one outlier.

Snap & solve any problem in the app
Get step-by-step solutions on Sovi AI
Photo-based solutions with guided steps
Explore more problems and detailed explanations
The scatter plot shows negative linear with one outlier association because as the plotted values of \( x \) increase, the values of \( y \) generally decrease.