QUESTION IMAGE
Question
question
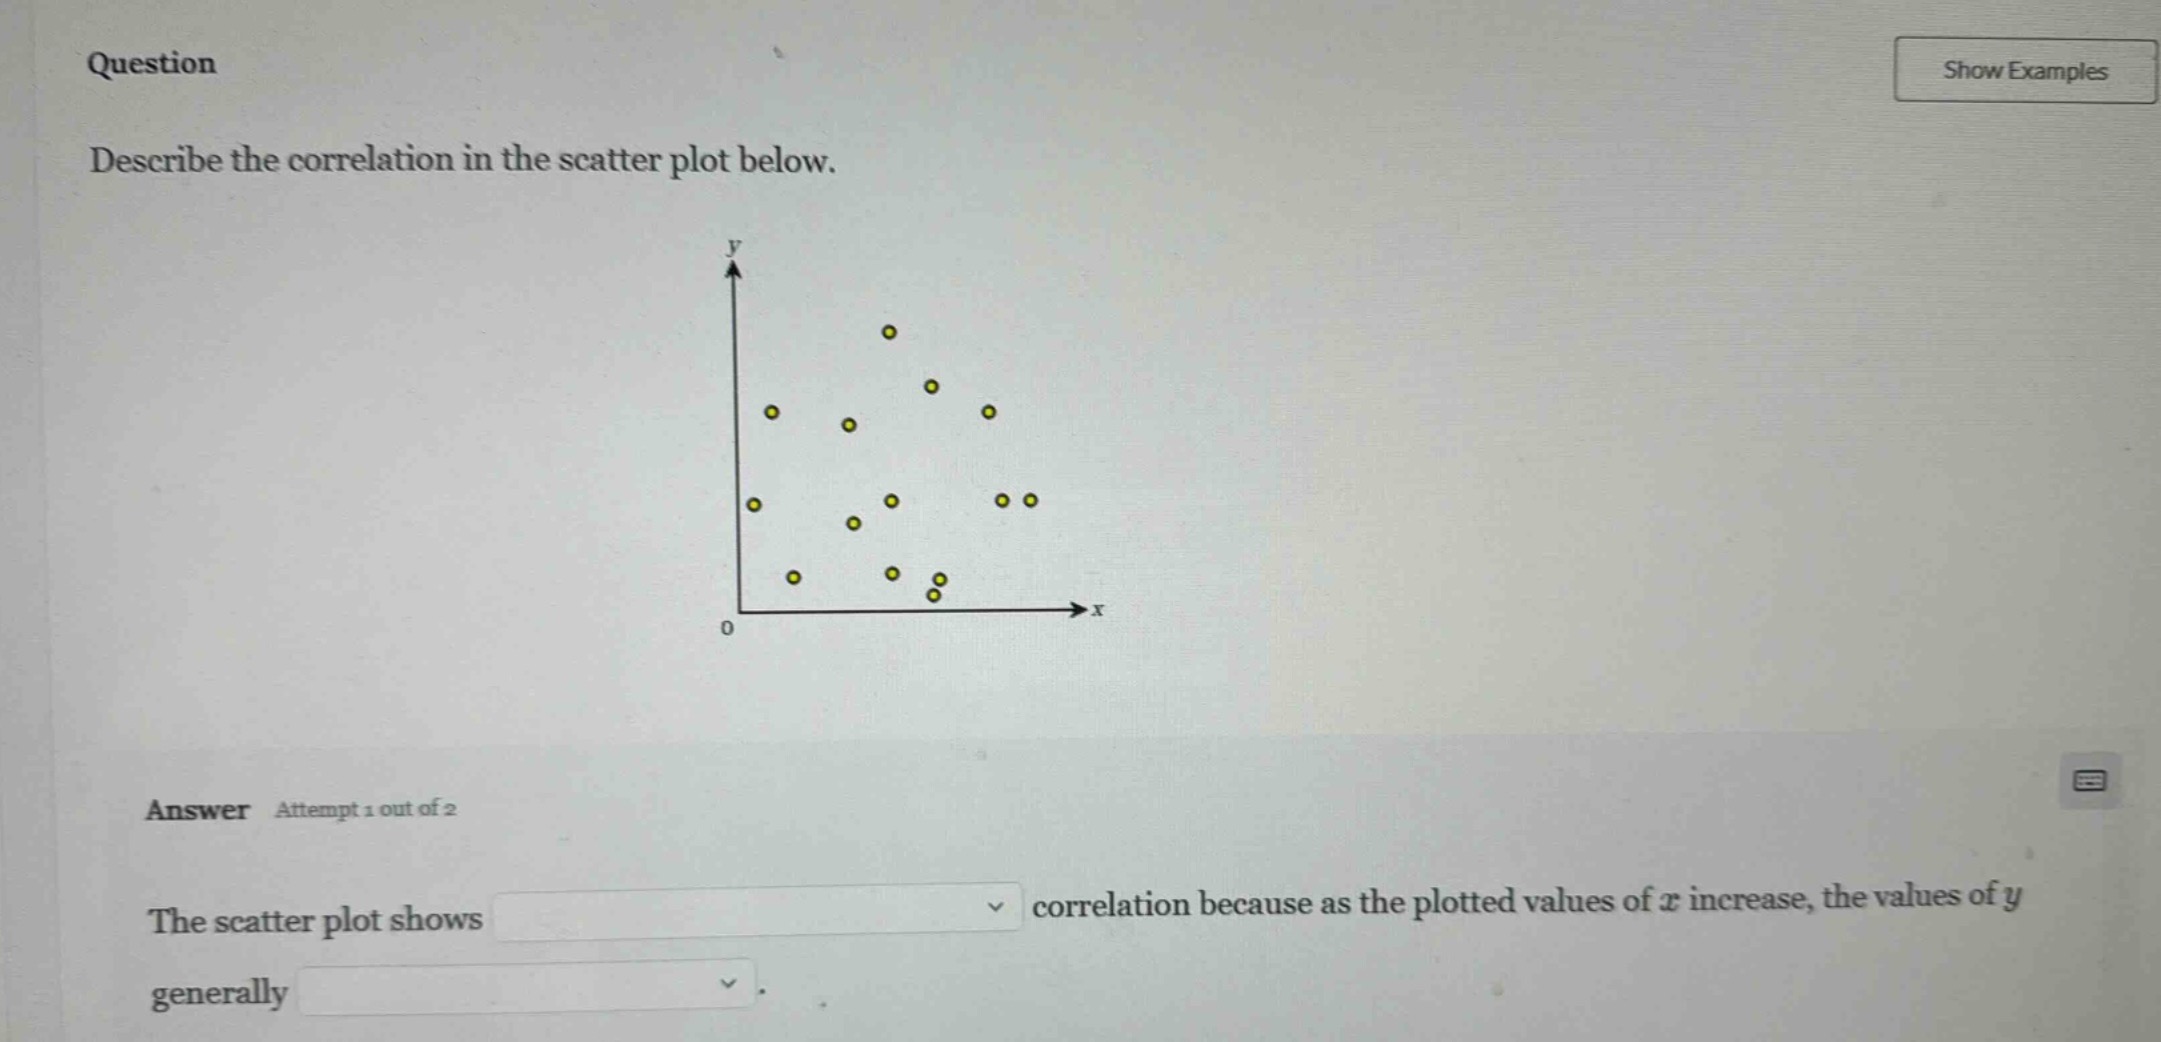
describe the correlation in the scatter plot below.
answer attempt 1 out of 2
the scatter plot shows correlation because as the plotted values of ( x ) increase, the values of ( y ) generally .
Brief Explanations
Observing the scatter plot, there is a loose, downward trend: as $x$ values get larger, $y$ values tend to get smaller, but the points are not tightly clustered around a clear line, so the correlation is weak negative.

Snap & solve any problem in the app
Get step-by-step solutions on Sovi AI
Photo-based solutions with guided steps
Explore more problems and detailed explanations
The scatter plot shows weak negative correlation because as the plotted values of $x$ increase, the values of $y$ generally decrease.