QUESTION IMAGE
Question
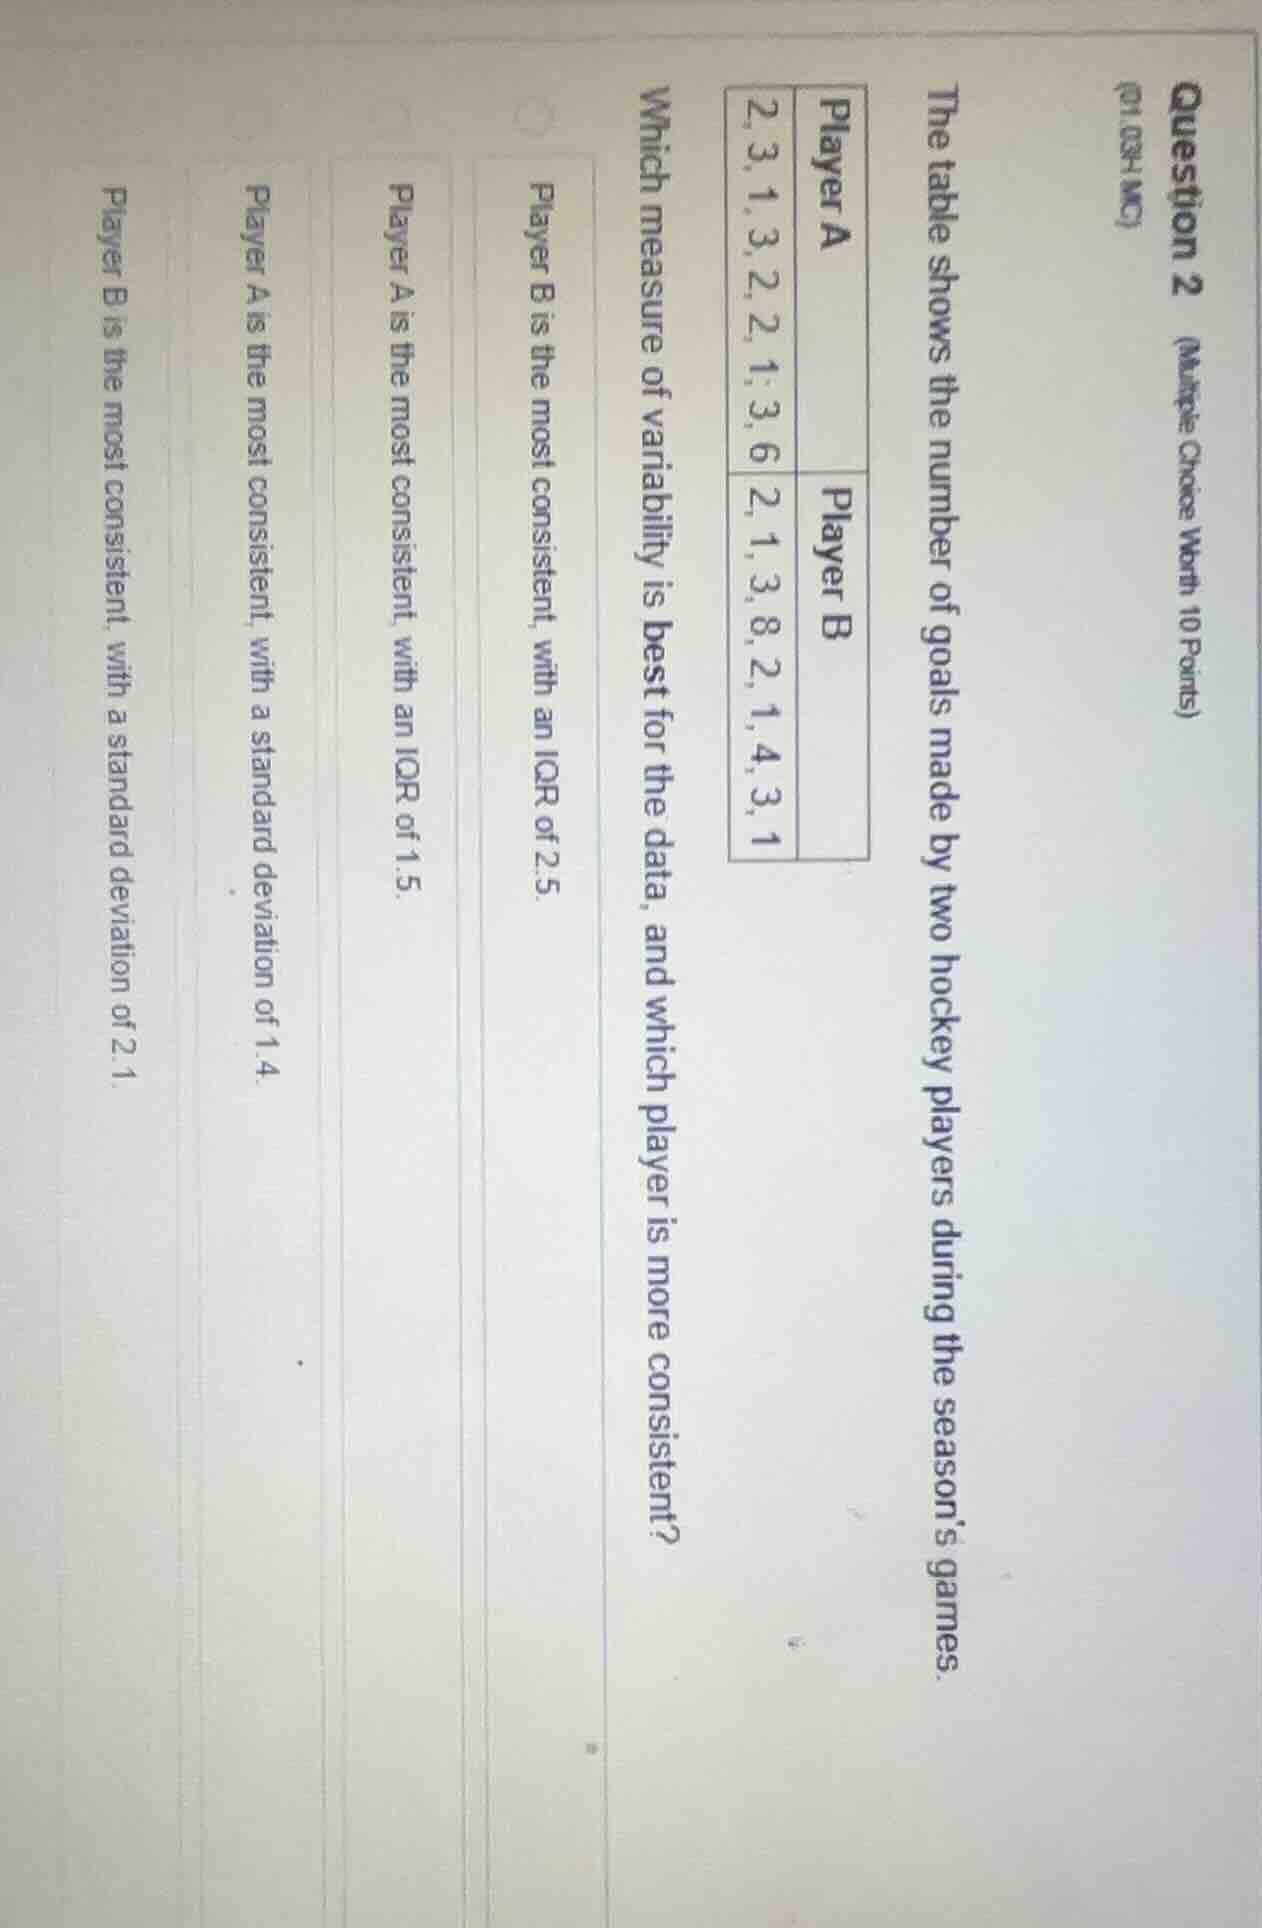
question 2 (multiple choice worth 10 points) (01.03h mc) the table shows the number of goals made by two hockey players during the season’s games. player a: 2, 3, 1, 3, 2, 2, 1, 3, 6 player b: 2, 1, 3, 8, 2, 1, 4, 3, 1 which measure of variability is best for the data, and which player is more consistent? player b is the most consistent, with an iqr of 2.5. player a is the most consistent, with an iqr of 1.5. player a is the most consistent, with a standard deviation of 1.4. player b is the most consistent, with a standard deviation of 2.1
Step1: Identify outlier in Player B data
Player B has a value 8, which is an outlier.
Step2: Choose appropriate variability measure
When outliers exist, IQR (Interquartile Range) is a better measure of variability than standard deviation, as it is not affected by extreme values.
Step3: Calculate IQR for Player A
Sort Player A's data: $1,1,2,2,2,3,3,6$
Find median: $\frac{2+2}{2}=2$
Q1 (median of lower half): $\frac{1+2}{2}=1.5$
Q3 (median of upper half): $\frac{3+3}{2}=3$
IQR = Q3 - Q1 = $3 - 1.5 = 1.5$
Step4: Calculate IQR for Player B
Sort Player B's data: $1,1,2,3,3,4,8$
Find median: $3$
Q1 (median of lower half): $1$
Q3 (median of upper half): $4$
IQR = Q3 - Q1 = $4 - 1 = 3$
Step5: Determine consistency
A smaller IQR means more consistency. Player A has a smaller IQR.

Snap & solve any problem in the app
Get step-by-step solutions on Sovi AI
Photo-based solutions with guided steps
Explore more problems and detailed explanations
Player A is the most consistent, with an IQR of 1.5.