QUESTION IMAGE
Question
question
part 3 of 3 completed: 7 of 9 my score: 7/9 pts (77.78%)
save
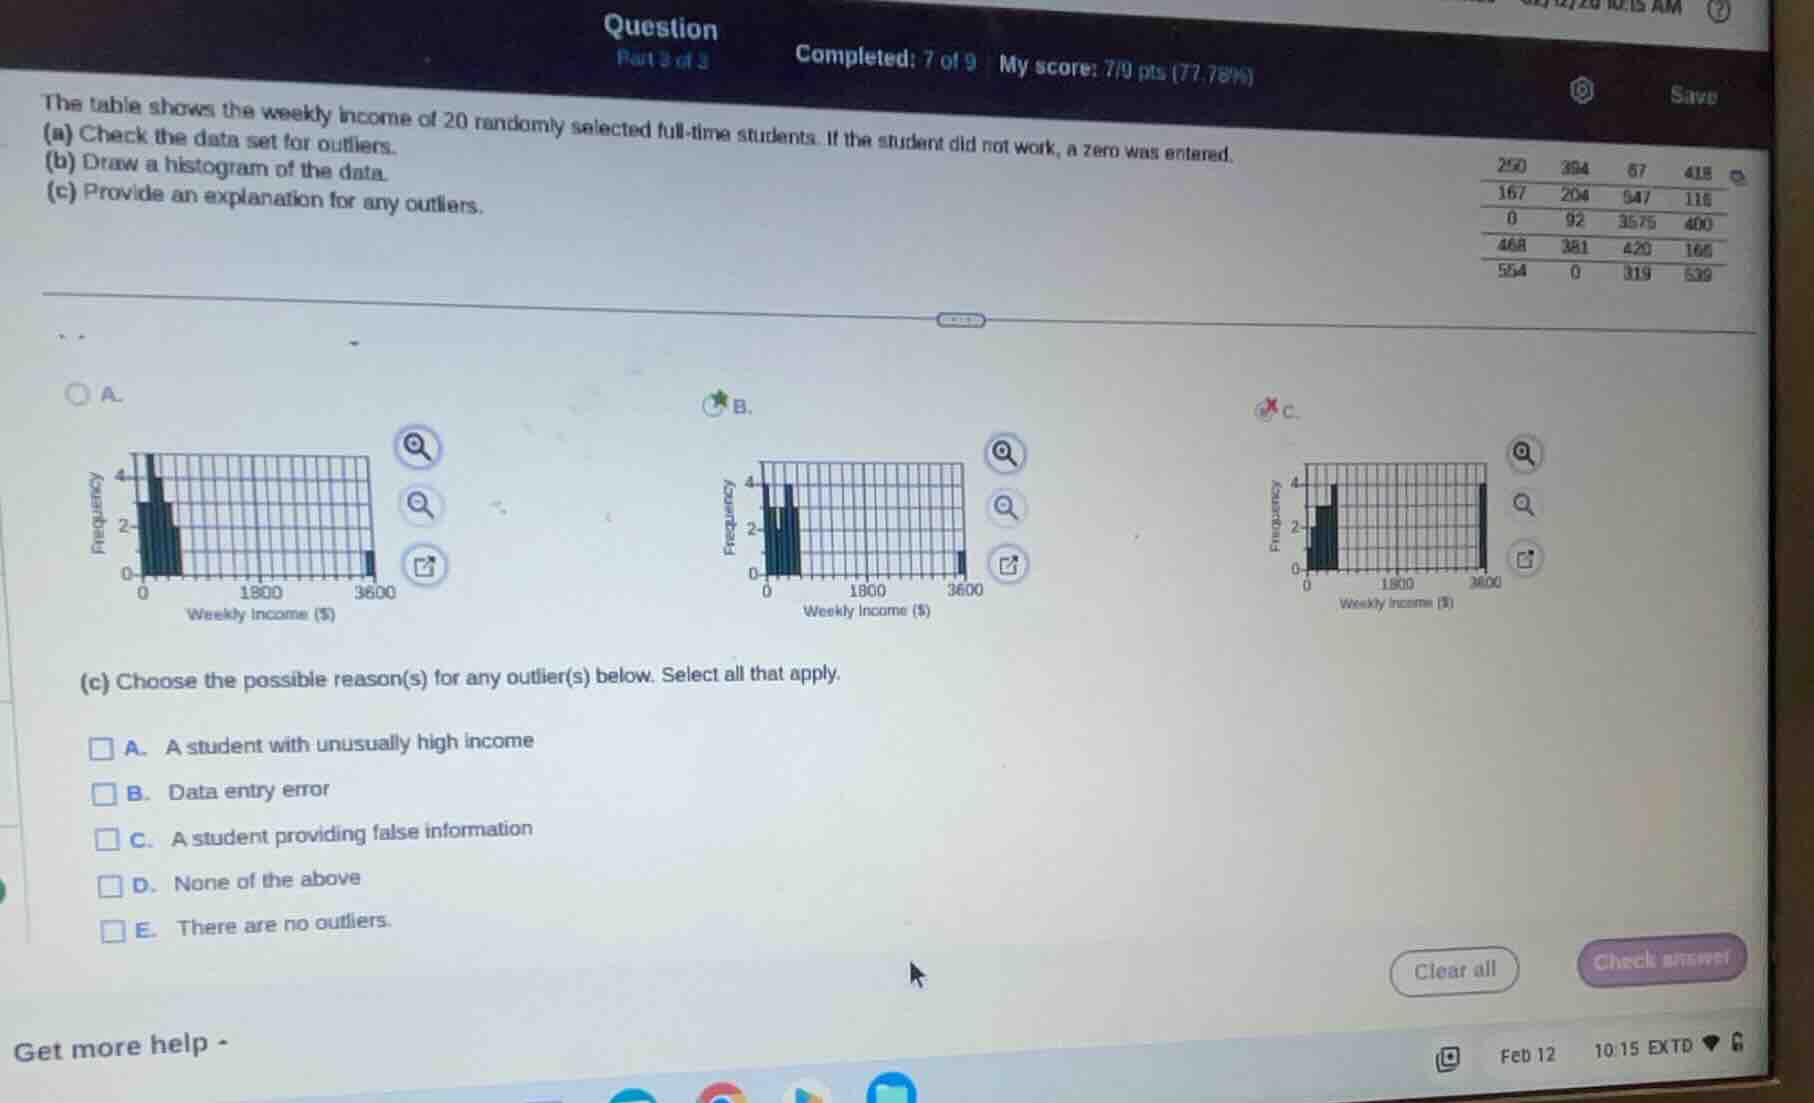
the table shows the weekly income of 20 randomly selected full-time students. if the student did not work, a zero was entered.
(a) check the data set for outliers.
(b) draw a histogram of the data.
(c) provide an explanation for any outliers.
290 394 87 418
167 204 947 116
0 92 3575 400
468 381 420 165
554 0 319 539
a.
b.
c.
(c) choose the possible reason(s) for any outlier(s) below. select all that apply.
a. a student with unusually high income
b. data entry error
c. a student providing false information
d. none of the above
e. there are no outliers.
clear all check answer
get more help -
Step1: List and sort all data
First, compile all 20 data points: 290, 394, 67, 418, 167, 204, 947, 116, 0, 92, 3575, 400, 468, 381, 420, 165, 554, 0, 319, 539.
Sort them: $0, 0, 67, 92, 116, 165, 167, 204, 290, 319, 381, 394, 400, 418, 420, 468, 539, 554, 947, 3575$
Step2: Calculate quartiles and IQR
Find $Q_1$ (median of lower half): Lower half = $0, 0, 67, 92, 116, 165, 167, 204, 290, 319$
$Q_1 = \frac{116 + 165}{2} = 140.5$
Find $Q_3$ (median of upper half): Upper half = $381, 394, 400, 418, 420, 468, 539, 554, 947, 3575$
$Q_3 = \frac{420 + 468}{2} = 444$
Calculate IQR: $IQR = Q_3 - Q_1 = 444 - 140.5 = 303.5$
Step3: Identify outlier bounds
Lower bound: $Q_1 - 1.5 \times IQR = 140.5 - 1.5 \times 303.5 = 140.5 - 455.25 = -314.75$
Upper bound: $Q_3 + 1.5 \times IQR = 444 + 1.5 \times 303.5 = 444 + 455.25 = 899.25$
Any value outside $(-314.75, 899.25)$ is an outlier: 947, 3575
Step4: Match to correct histogram
Most data falls between $0-900$, with two high outliers. Histogram B has most frequency in low income bins and a small bar for high income, matching the data.
Step5: Explain outlier reasons
947 and 3575 are unusually high for student weekly income. A data entry error (e.g., 357.5 typed as 3575) or a student with an unusual high income (e.g., high-paying part-time job) are plausible.

Snap & solve any problem in the app
Get step-by-step solutions on Sovi AI
Photo-based solutions with guided steps
Explore more problems and detailed explanations
(a) The outliers are 947 and 3575.
(b) B. (the histogram with most frequency in low income ranges and a small bar for the highest range)
(c) A. A student with unusually high income, B. Data entry error