QUESTION IMAGE
Question
question 5 of 5
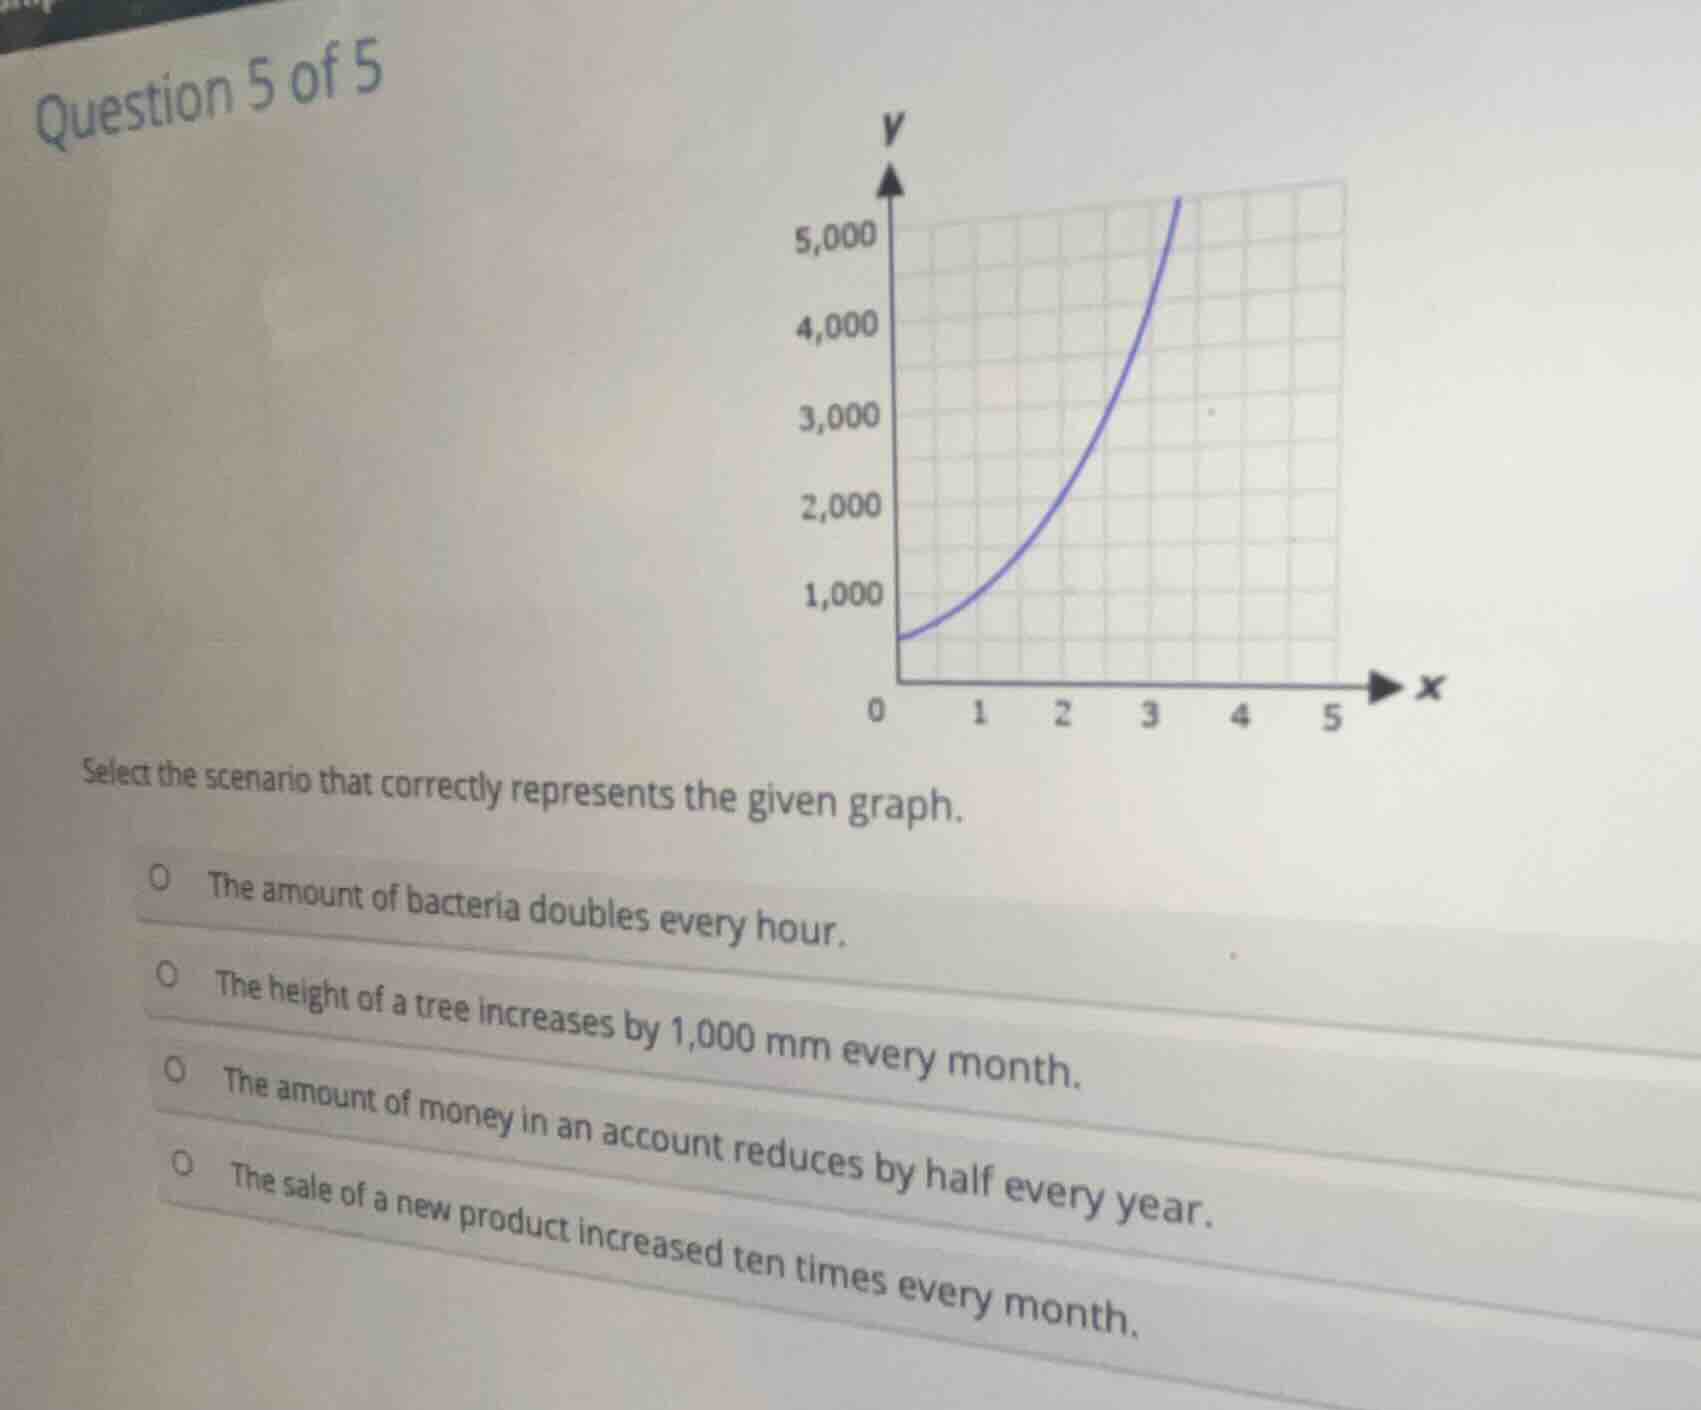
select the scenario that correctly represents the given graph.
○ the amount of bacteria doubles every hour.
○ the height of a tree increases by 1,000 mm every month.
○ the amount of money in an account reduces by half every year.
○ the sale of a new product increased ten times every month.
Brief Explanations
The graph shows exponential growth, where the value increases at an accelerating rate.
- The tree height scenario describes linear growth (constant 1000 mm increase monthly), which would be a straight line, not a curve.
- The money reduction scenario is exponential decay, which would slope downward, not upward.
- The product sales scenario claims a 10x monthly increase, which would be far steeper than the given graph.
- The bacteria doubling every hour matches the upward-curving exponential growth shown in the graph.

Snap & solve any problem in the app
Get step-by-step solutions on Sovi AI
Photo-based solutions with guided steps
Explore more problems and detailed explanations
A. The amount of bacteria doubles every hour.