QUESTION IMAGE
Question
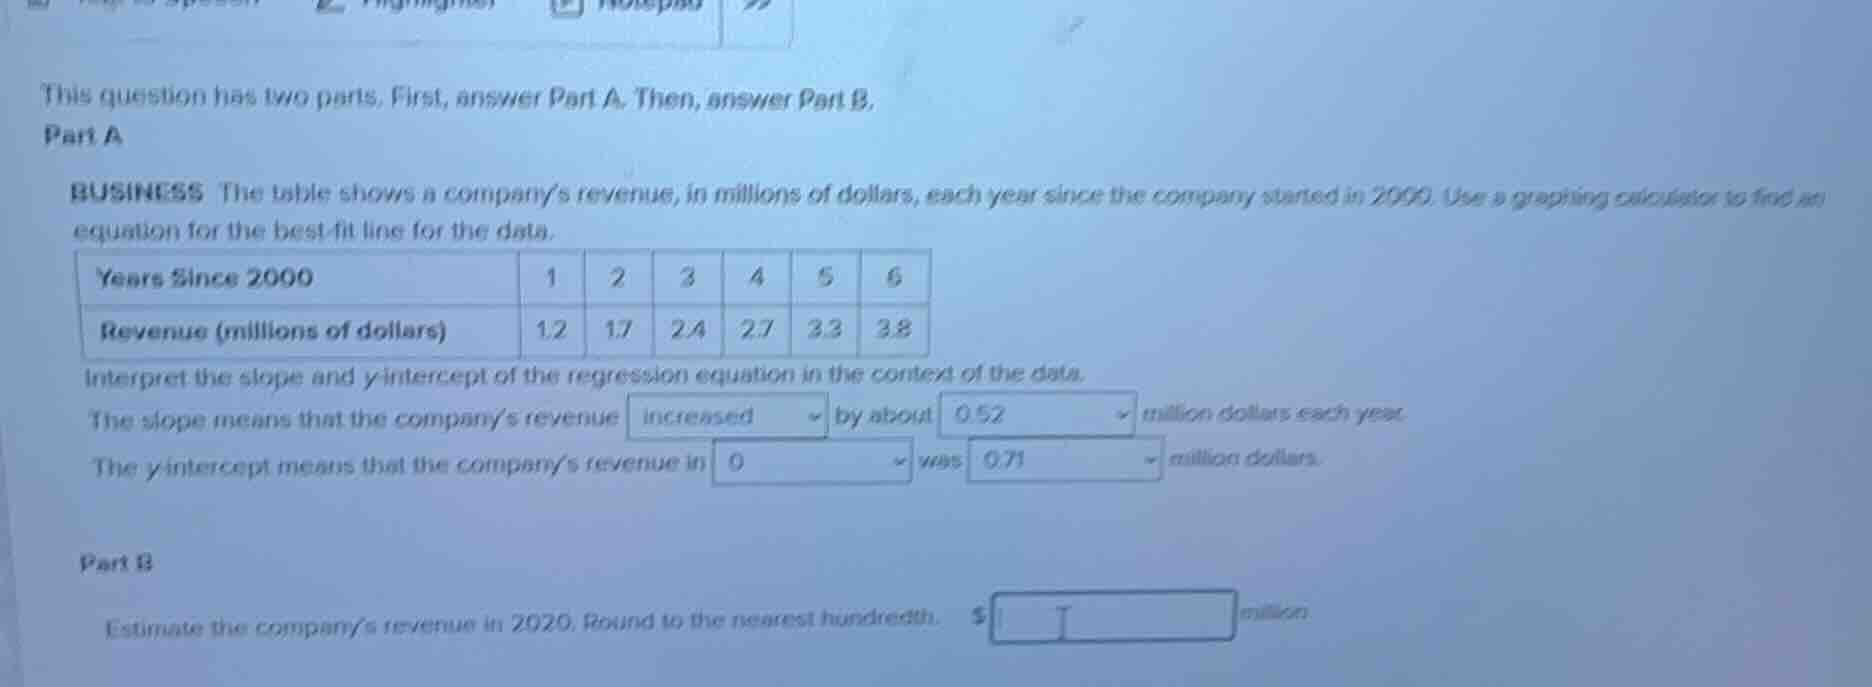
this question has two parts. first, answer part a. then, answer part b.
part a
business the table shows a company’s revenue, in millions of dollars, each year since the company started in 2000. use a graphing calculator to find an equation for the best - fit line for the data.
| years since 2000 | 1 | 2 | 3 | 4 | 5 | 6 |
|---|
interpret the slope and y - intercept of the regression equation in the context of the data.
the slope means that the company’s revenue increased by about 0.52 million dollars each year.
the y - intercept means that the company’s revenue in 0 was 0.71 million dollars.
part b
estimate the company’s revenue in 2020. round to the nearest hundredth. $\square$ million.
Step1: Define variables
Let $x$ = years since 2000, $y$ = revenue (millions).
Step2: Use regression equation
From Part A, regression line: $y = 0.52x + 0.71$
Step3: Calculate x for 2020
$x = 2020 - 2000 = 20$
Step4: Substitute x into equation
$y = 0.52(20) + 0.71 = 10.4 + 0.71$

Snap & solve any problem in the app
Get step-by-step solutions on Sovi AI
Photo-based solutions with guided steps
Explore more problems and detailed explanations
11.11