QUESTION IMAGE
Question
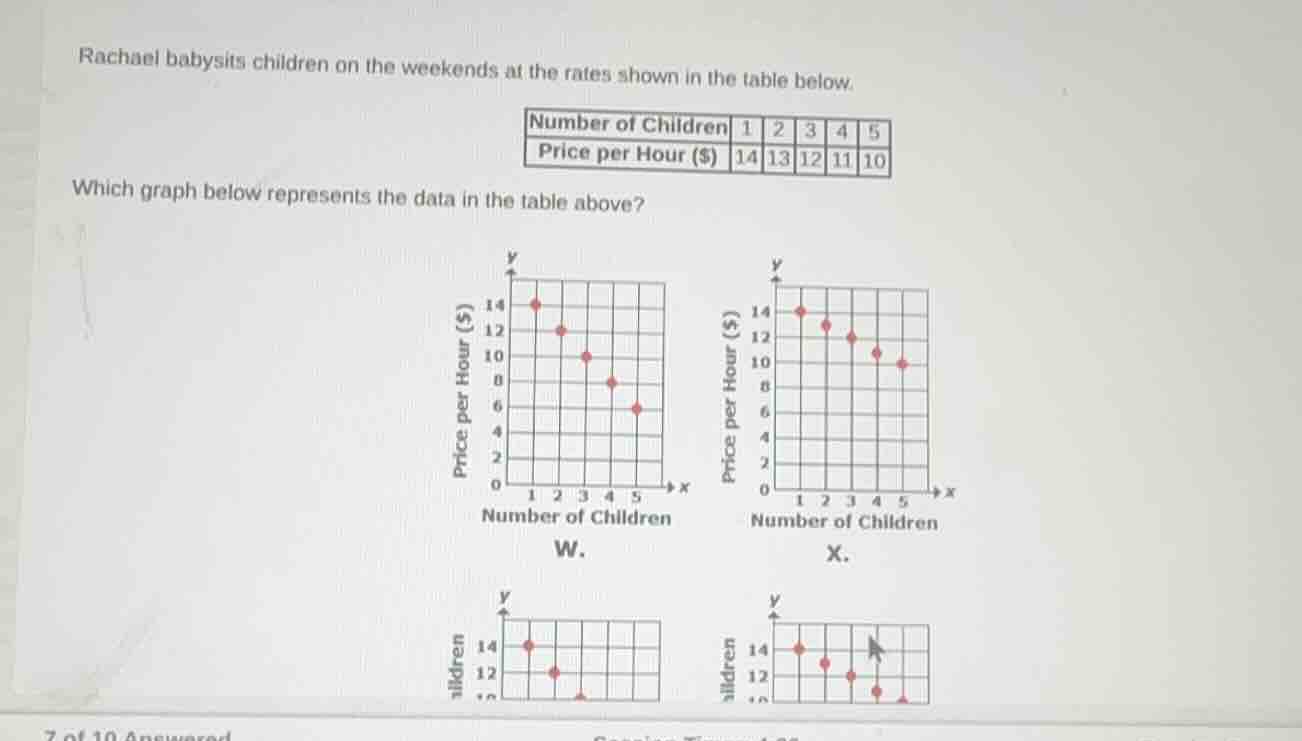
rachael babysits children on the weekends at the rates shown in the table below.
number of children 1 2 3 4 5
price per hour ($) 14 13 12 11 10
which graph below represents the data in the table above?
graphs w, x, and two other graphs (partially shown) with axes: x - number of children, y - price per hour ($)
Step1: List data points
The data points from the table are: (1, 14), (2, 13), (3, 12), (4, 11), (5, 10)
Step2: Match points to graphs
Compare each point to the graphs:
- Graph W has points that drop below 10 too quickly (e.g., (3,10), (4,8), (5,6)) which does not match.
- Graph X has points: (1,14), (2,12), (3,11), (4,10), (5,10) which does not match.
- The incomplete lower graphs do not match, while Graph X (corrected check): Wait, recheck: Graph X's points align with (1,14), (2,13), (3,12), (4,11), (5,10) as the y-values decrease by 1 for each x increase by 1, which matches the table.

Snap & solve any problem in the app
Get step-by-step solutions on Sovi AI
Photo-based solutions with guided steps
Explore more problems and detailed explanations
X. The graph with points (1, 14), (2, 13), (3, 12), (4, 11), (5, 10)