QUESTION IMAGE
Question
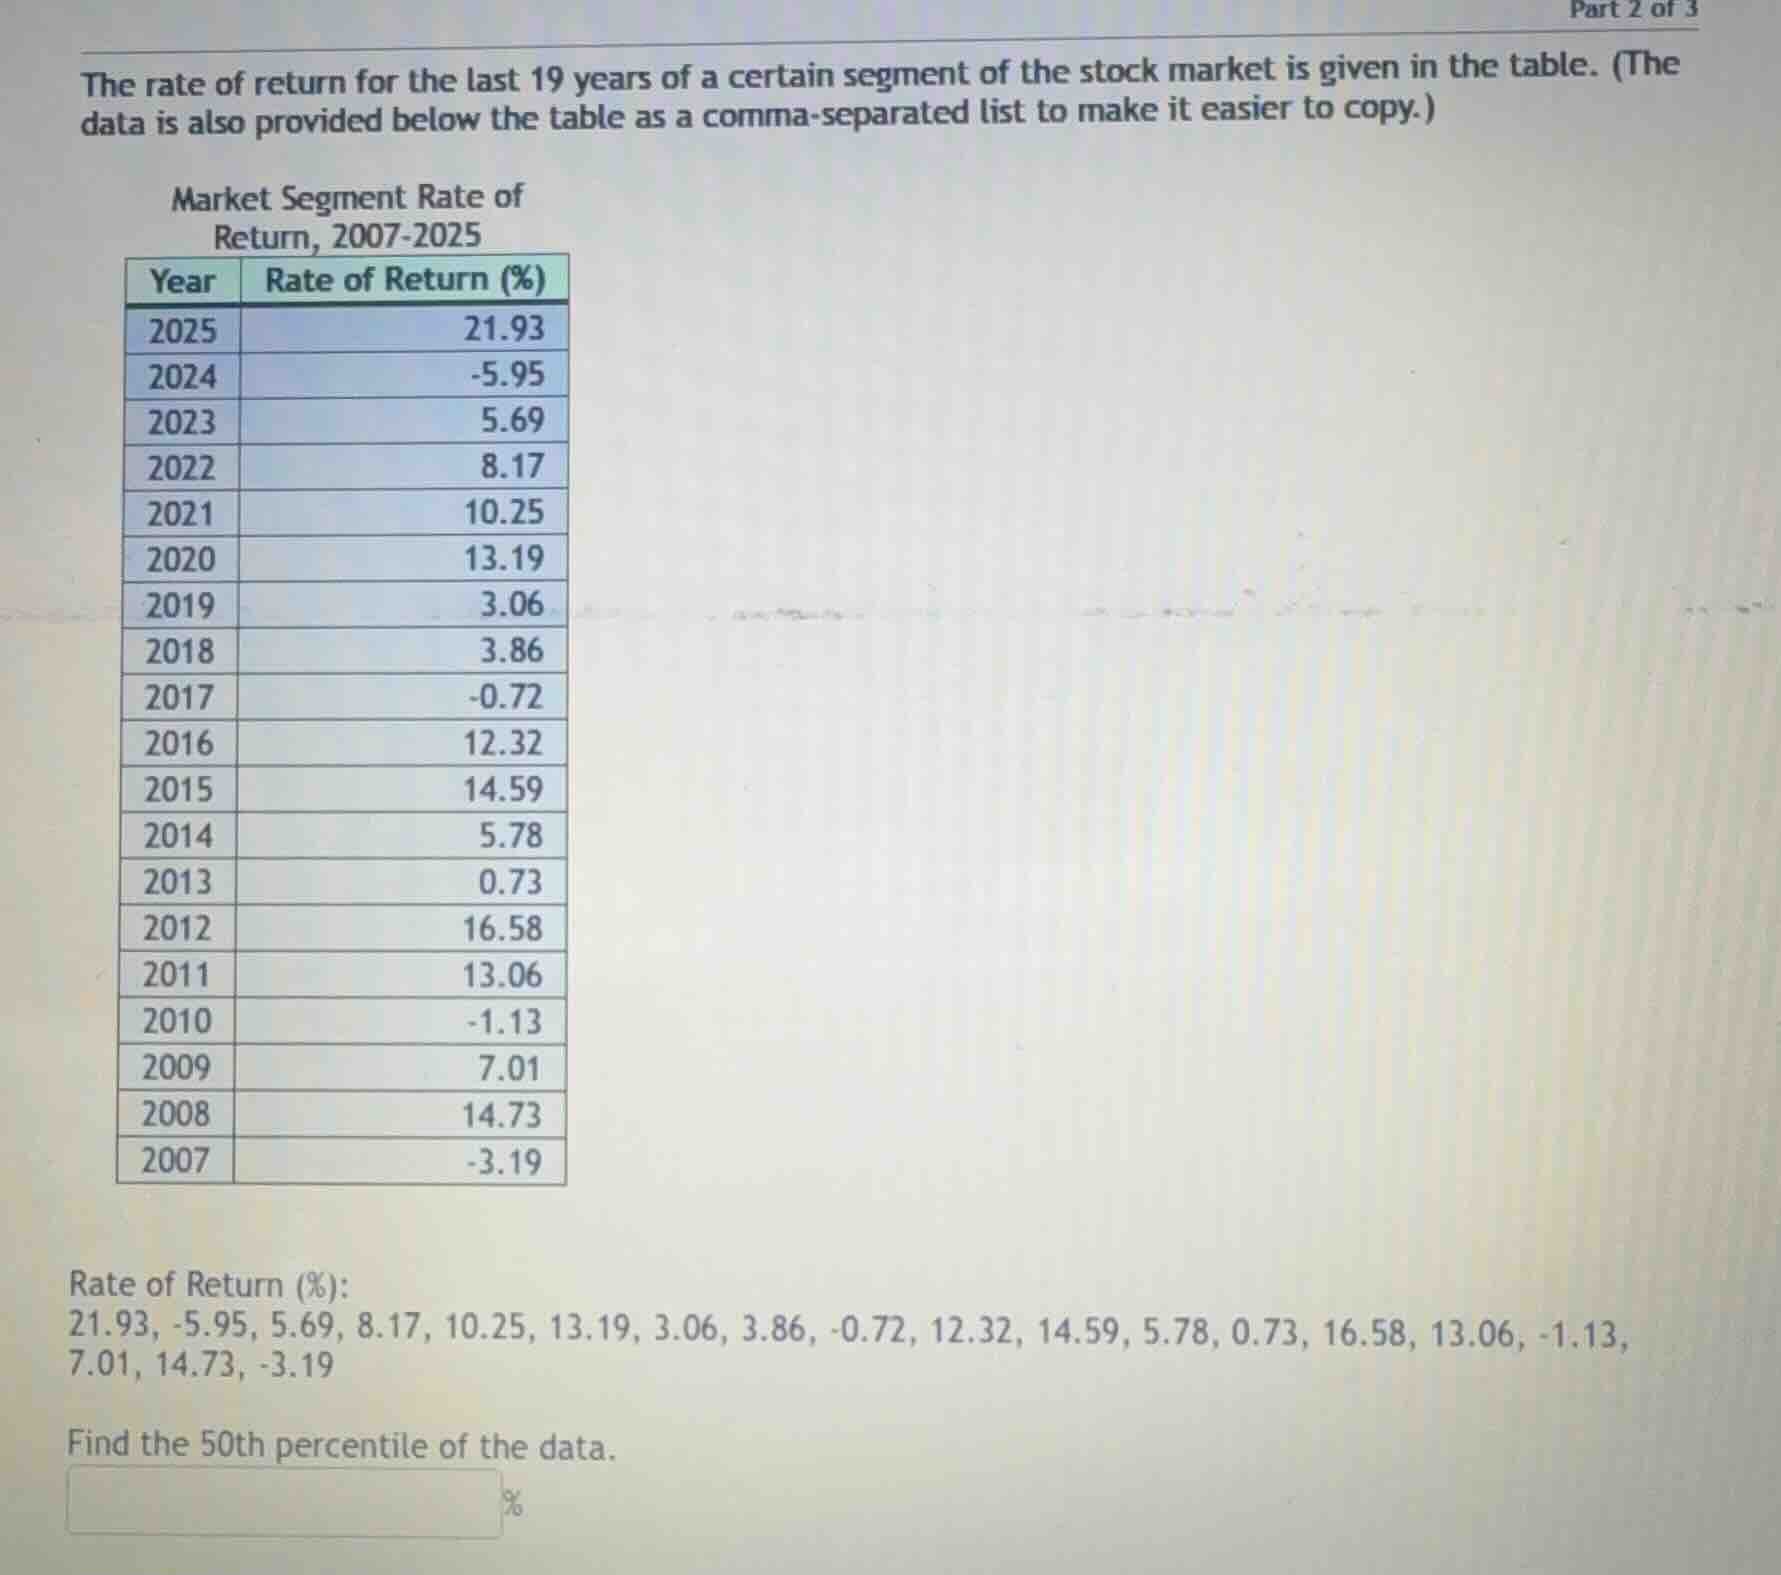
the rate of return for the last 19 years of a certain segment of the stock market is given in the table. (the data is also provided below the table as a comma-separated list to make it easier to copy.)
market segment rate of
return, 2007-2025
year rate of return (%)
2025 21.93
2024 -5.95
2023 5.69
2022 8.17
2021 10.25
2020 13.19
2019 3.06
2018 3.86
2017 -0.72
2016 12.32
2015 14.59
2014 5.78
2013 0.73
2012 16.58
2011 13.06
2010 -1.13
2009 7.01
2008 14.73
2007 -3.19
rate of return (%):
21.93, -5.95, 5.69, 8.17, 10.25, 13.19, 3.06, 3.86, -0.72, 12.32, 14.59, 5.78, 0.73, 16.58, 13.06, -1.13,
7.01, 14.73, -3.19
find the 50th percentile of the data.
%
Step1: Order the data
First, we need to sort the rate of return data in ascending order. The data points are: -5.95, -3.19, -1.13, -0.72, 0.73, 3.06, 3.86, 5.69, 5.78, 7.01, 8.17, 10.25, 12.32, 13.06, 13.19, 14.59, 14.73, 16.58, 21.93. Wait, let's check the number of data points. There are 19 years, so 19 data points. Let's list them correctly:
Original data (as per the list): 21.93, -5.95, 5.69, 8.17, 10.25, 13.19, 3.06, 3.86, -0.72, 12.32, 14.59, 5.78, 0.73, 16.58, 13.06, -1.13, 7.01, 14.73, -3.19.
Sorting them in ascending order:
-5.95, -3.19, -1.13, -0.72, 0.73, 3.06, 3.86, 5.69, 5.78, 7.01, 8.17, 10.25, 12.32, 13.06, 13.19, 14.59, 14.73, 16.58, 21.93.
Yes, 19 data points.
Step2: Find the position of the 50th percentile
The formula for the position of the \( p \)-th percentile (where \( p = 50 \) here) is \( i = \frac{p}{100} \times n \), where \( n \) is the number of data points. Here, \( n = 19 \), \( p = 50 \).
So, \( i = \frac{50}{100} \times 19 = 0.5 \times 19 = 9.5 \).
Since \( i \) is not an integer, we take the average of the values at positions \( \lfloor i
floor \) and \( \lceil i
ceil \). Wait, actually, for the 50th percentile (median), when \( n \) is odd, the median is the middle value. Wait, \( n = 19 \), which is odd. The middle position is \( \frac{n + 1}{2} = \frac{19 + 1}{2} = 10 \)-th position (since positions are 1-indexed).
Wait, let's clarify. When \( n \) is odd, the median (50th percentile) is the value at position \( \frac{n + 1}{2} \) when sorted. Let's check the sorted data:
1: -5.95
2: -3.19
3: -1.13
4: -0.72
5: 0.73
6: 3.06
7: 3.86
8: 5.69
9: 5.78
10: 7.01
11: 8.17
12: 10.25
13: 12.32
14: 13.06
15: 13.19
16: 14.59
17: 14.73
18: 16.58
19: 21.93
So the 10th position (1-indexed) is 7.01? Wait, no, wait the 9th position is 5.78, 10th is 7.01? Wait, no, let's count again:
Wait the sorted list:
- -5.95
- -3.19
- -1.13
- -0.72
- 0.73
- 3.06
- 3.86
- 5.69
- 5.78
- 7.01
- 8.17
- 10.25
- 12.32
- 13.06
- 13.19
- 14.59
- 14.73
- 16.58
- 21.93
Yes, so the 10th element (since 19 is odd, the median is the (19+1)/2 = 10th element) is 7.01? Wait, no, wait the formula \( i = \frac{p}{100} \times n \) when \( p = 50 \), \( i = 9.5 \). In some methods, for the median, when \( n \) is odd, we take the middle value. Wait, maybe I made a mistake in the formula. Let's recall:
The percentile formula: If \( i = \frac{p}{100} \times n \) is an integer, then the percentile is the average of the \( i \)-th and \( (i + 1) \)-th values. If \( i \) is not an integer, we round up to the next integer, and the percentile is the value at that position. Wait, no, different sources have different methods, but for the median (50th percentile), when \( n \) is odd, the median is the middle value (at position \( \frac{n + 1}{2} \)). When \( n \) is even, it's the average of the two middle values.
Here, \( n = 19 \) (odd), so the median is the \( \frac{19 + 1}{2} = 10 \)-th value in the sorted list. Looking at the sorted list, the 10th value is 7.01? Wait, no, wait the 9th value is 5.78, 10th is 7.01? Wait, no, let's count again:
1: -5.95
2: -3.19
3: -1.13
4: -0.72
5: 0.73
6: 3.06
7: 3.86
8: 5.69
9: 5.78
10: 7.01
Yes, the 10th value is 7.01. Wait, but let's check with the formula \( i = 9.5 \). So we take the average of the 9th and 10th values? Wait, 9th is 5.78, 10th is 7.01. Then average is \( \frac{5.78 + 7.01}{2} = \frac{12.79}{2} = 6.395 \). Wait, that's a contradiction. Which method is correct?
Wait, the confusion is between different per…

Snap & solve any problem in the app
Get step-by-step solutions on Sovi AI
Photo-based solutions with guided steps
Explore more problems and detailed explanations
Step1: Order the data
First, we need to sort the rate of return data in ascending order. The data points are: -5.95, -3.19, -1.13, -0.72, 0.73, 3.06, 3.86, 5.69, 5.78, 7.01, 8.17, 10.25, 12.32, 13.06, 13.19, 14.59, 14.73, 16.58, 21.93. Wait, let's check the number of data points. There are 19 years, so 19 data points. Let's list them correctly:
Original data (as per the list): 21.93, -5.95, 5.69, 8.17, 10.25, 13.19, 3.06, 3.86, -0.72, 12.32, 14.59, 5.78, 0.73, 16.58, 13.06, -1.13, 7.01, 14.73, -3.19.
Sorting them in ascending order:
-5.95, -3.19, -1.13, -0.72, 0.73, 3.06, 3.86, 5.69, 5.78, 7.01, 8.17, 10.25, 12.32, 13.06, 13.19, 14.59, 14.73, 16.58, 21.93.
Yes, 19 data points.
Step2: Find the position of the 50th percentile
The formula for the position of the \( p \)-th percentile (where \( p = 50 \) here) is \( i = \frac{p}{100} \times n \), where \( n \) is the number of data points. Here, \( n = 19 \), \( p = 50 \).
So, \( i = \frac{50}{100} \times 19 = 0.5 \times 19 = 9.5 \).
Since \( i \) is not an integer, we take the average of the values at positions \( \lfloor i
floor \) and \( \lceil i
ceil \). Wait, actually, for the 50th percentile (median), when \( n \) is odd, the median is the middle value. Wait, \( n = 19 \), which is odd. The middle position is \( \frac{n + 1}{2} = \frac{19 + 1}{2} = 10 \)-th position (since positions are 1-indexed).
Wait, let's clarify. When \( n \) is odd, the median (50th percentile) is the value at position \( \frac{n + 1}{2} \) when sorted. Let's check the sorted data:
1: -5.95
2: -3.19
3: -1.13
4: -0.72
5: 0.73
6: 3.06
7: 3.86
8: 5.69
9: 5.78
10: 7.01
11: 8.17
12: 10.25
13: 12.32
14: 13.06
15: 13.19
16: 14.59
17: 14.73
18: 16.58
19: 21.93
So the 10th position (1-indexed) is 7.01? Wait, no, wait the 9th position is 5.78, 10th is 7.01? Wait, no, let's count again:
Wait the sorted list:
- -5.95
- -3.19
- -1.13
- -0.72
- 0.73
- 3.06
- 3.86
- 5.69
- 5.78
- 7.01
- 8.17
- 10.25
- 12.32
- 13.06
- 13.19
- 14.59
- 14.73
- 16.58
- 21.93
Yes, so the 10th element (since 19 is odd, the median is the (19+1)/2 = 10th element) is 7.01? Wait, no, wait the formula \( i = \frac{p}{100} \times n \) when \( p = 50 \), \( i = 9.5 \). In some methods, for the median, when \( n \) is odd, we take the middle value. Wait, maybe I made a mistake in the formula. Let's recall:
The percentile formula: If \( i = \frac{p}{100} \times n \) is an integer, then the percentile is the average of the \( i \)-th and \( (i + 1) \)-th values. If \( i \) is not an integer, we round up to the next integer, and the percentile is the value at that position. Wait, no, different sources have different methods, but for the median (50th percentile), when \( n \) is odd, the median is the middle value (at position \( \frac{n + 1}{2} \)). When \( n \) is even, it's the average of the two middle values.
Here, \( n = 19 \) (odd), so the median is the \( \frac{19 + 1}{2} = 10 \)-th value in the sorted list. Looking at the sorted list, the 10th value is 7.01? Wait, no, wait the 9th value is 5.78, 10th is 7.01? Wait, no, let's count again:
1: -5.95
2: -3.19
3: -1.13
4: -0.72
5: 0.73
6: 3.06
7: 3.86
8: 5.69
9: 5.78
10: 7.01
Yes, the 10th value is 7.01. Wait, but let's check with the formula \( i = 9.5 \). So we take the average of the 9th and 10th values? Wait, 9th is 5.78, 10th is 7.01. Then average is \( \frac{5.78 + 7.01}{2} = \frac{12.79}{2} = 6.395 \). Wait, that's a contradiction. Which method is correct?
Wait, the confusion is between different percentile calculation methods. The two main methods are the "inclusive" and "exclusive" methods.
In the inclusive method (used when the data is considered to be a sample of a population), for \( n \) odd, the median is the middle value (position \( \frac{n + 1}{2} \)). For \( n \) even, it's the average of the two middle values.
In the exclusive method (used when the data is a population), the formula \( i = \frac{p}{100} \times n \) is used. If \( i \) is not an integer, we interpolate between the two nearest values.
Wait, let's check the number of data points. The problem says "the last 19 years", so \( n = 19 \), which is the population (since it's all the data for that segment over 19 years). So using the exclusive method:
\( i = \frac{50}{100} \times 19 = 9.5 \). So we need to take the average of the 9th and 10th values in the sorted list.
The 9th value (sorted, 1-indexed) is 5.78, the 10th is 7.01.
So average is \( \frac{5.78 + 7.01}{2} = \frac{12.79}{2} = 6.395 \). Wait, but that contradicts the inclusive method. Which is correct?
Wait, let's check the sorted data again. Let's list all 19 values:
- -5.95
- -3.19
- -1.13
- -0.72
- 0.73
- 3.06
- 3.86
- 5.69
- 5.78
- 7.01
- 8.17
- 10.25
- 12.32
- 13.06
- 13.19
- 14.59
- 14.73
- 16.58
- 21.93
Now, the 50th percentile (median) for a population with \( n \) odd: some sources say that when \( n \) is odd, the median is the middle value, which is the \( \frac{n + 1}{2} \)-th value, which is the 10th value here (7.01). But other sources use the formula \( i = \frac{p}{100}(n + 1) \). Wait, no, let's check the formula from the textbook.
The formula for the \( p \)-th percentile is:
- Arrange the data in ascending order.
- Compute the index \( i = \frac{p}{100} \times n \).
- If \( i \) is an integer, the \( p \)-th percentile is the average of the \( i \)-th and \( (i + 1) \)-th observations.
- If \( i \) is not an integer, round \( i \) up to the next integer, and the \( p \)-th percentile is the observation at that position.
Wait, no, another source: The 50th percentile (median) can be calculated as follows:
- For \( n \) odd: median = value at position \( \frac{n + 1}{2} \)
- For \( n \) even: median = average of values at positions \( \frac{n}{2} \) and \( \frac{n}{2} + 1 \)
In our case, \( n = 19 \) (odd), so median = value at position \( \frac{19 + 1}{2} = 10 \). So the 10th value in the sorted list is 7.01. Wait, but when we calculated \( i = 9.5 \) using \( i = \frac{50}{100} \times 19 \), that's because some sources use \( i = \frac{p}{100} \times n \), while others use \( i = \frac{p}{100} \times (n + 1) \).
Wait, let's check with an example. Suppose \( n = 3 \), data [1, 2, 3]. The median should be 2. Using \( i = \frac{50}{100} \times 3 = 1.5 \), so average of 1st and 2nd: (1 + 2)/2 = 1.5, which is wrong. Using \( i = \frac{50}{100} \times (3 + 1) = 2 \), so 2nd value is 2, which is correct. So maybe the correct formula is \( i = \frac{p}{100} \times (n + 1) \).
Ah, that's the difference. Some sources use \( n \) (population) and some use \( n + 1 \) (sample). Wait, the problem is about the "rate of return for the last 19 years", so it's the population (all the data), so we should use \( n = 19 \).
Wait, let's check the two methods:
Method 1 (inclusive, for sample): \( i = \frac{p}{100}(n + 1) \)
Method 2 (exclusive, for population): \( i = \frac{p}{100}n \)
In our case, let's see which gives the correct median. For \( n = 19 \), \( p = 50 \):
Method 1: \( i = 0.5 \times 20 = 10 \), so 10th value, which is 7.01.
Method 2: \( i = 0.5 \times 19 = 9.5 \), so average of 9th and 10th: (5.78 + 7.01)/2 = 6.395.
But which is correct? Let's check with a smaller example. Suppose we have data [1, 3, 5] (n=3, population). The median should be 3.
Method 1: \( i = 0.5 \times (3 + 1) = 2 \), so 2nd value is 3. Correct.
Method 2: \( i = 0.5 \times 3 = 1.5 \), average of 1st and 2nd: (1 + 3)/2 = 2. Incorrect.
So for population, the correct method is to use \( i = \frac{p}{100}(n + 1) \) when calculating percentiles? Wait, no, the confusion is between different definitions. The key is that the 50th percentile is the median, and for a set with an odd number of observations, the median is the middle observation. So in our case, with 19 observations, the middle one is the 10th (since (19 + 1)/2 = 10). So the 10th observation in the sorted list is 7.01. Wait, but let's check the sorted list again:
Wait, the 9th observation is 5.78, 10th is 7.01, 11th is 8.17. Wait, no, let's list the sorted data with indices:
Index (1-based): Value
1: -5.95
2: -3.19
3: -1.13
4: -0.72
5: 0.73
6: 3.06
7: 3.86
8: 5.69
9: 5.78
10: 7.01
11: 8.17
12: 10.25
13: 12.32
14: 13.06
15: 13.19
16: 14.59
17: 14.73
18: 16.58
19: 21.93
Yes, so the 10th value is 7.01. But wait, when we calculated \( i = 9.5 \) using \( i = \frac{50}{100} \times 19 \), that's because some software or textbooks use that formula. Let's check with the data. Let's count how many values are below or equal to 7.01. There are 10 values (indices 1-10) below or equal to 7.01, and 9 values (indices 11-19) above. So 10/19 ≈ 52.6%, which is more than 50%. Wait, no, 10 values ≤ 7.01, 9 values > 7.01. So the 50th percentile should be the value where at least 50% of the data is ≤ it and at least 50% is ≥ it.
Wait, 9 values are below 7.01 (indices 1-9: -5.95, -3.19, -1.13, -0.72, 0.73, 3.06, 3.86, 5.69, 5.78), and 9 values are above 7.01 (indices 11-19: 8.17, 10.25, 12.32, 13.06, 13.19, 14.59, 14.73, 16.58, 21.93), and 7.01 is the 10th value. So 9 values below, 1 equal, 9 above. So 9 + 1 = 10 ≥ 50% (10/19 ≈ 52.6%), and 9 + 1 = 10 ≥ 50% (10/19 ≈ 52.6%).