QUESTION IMAGE
Question
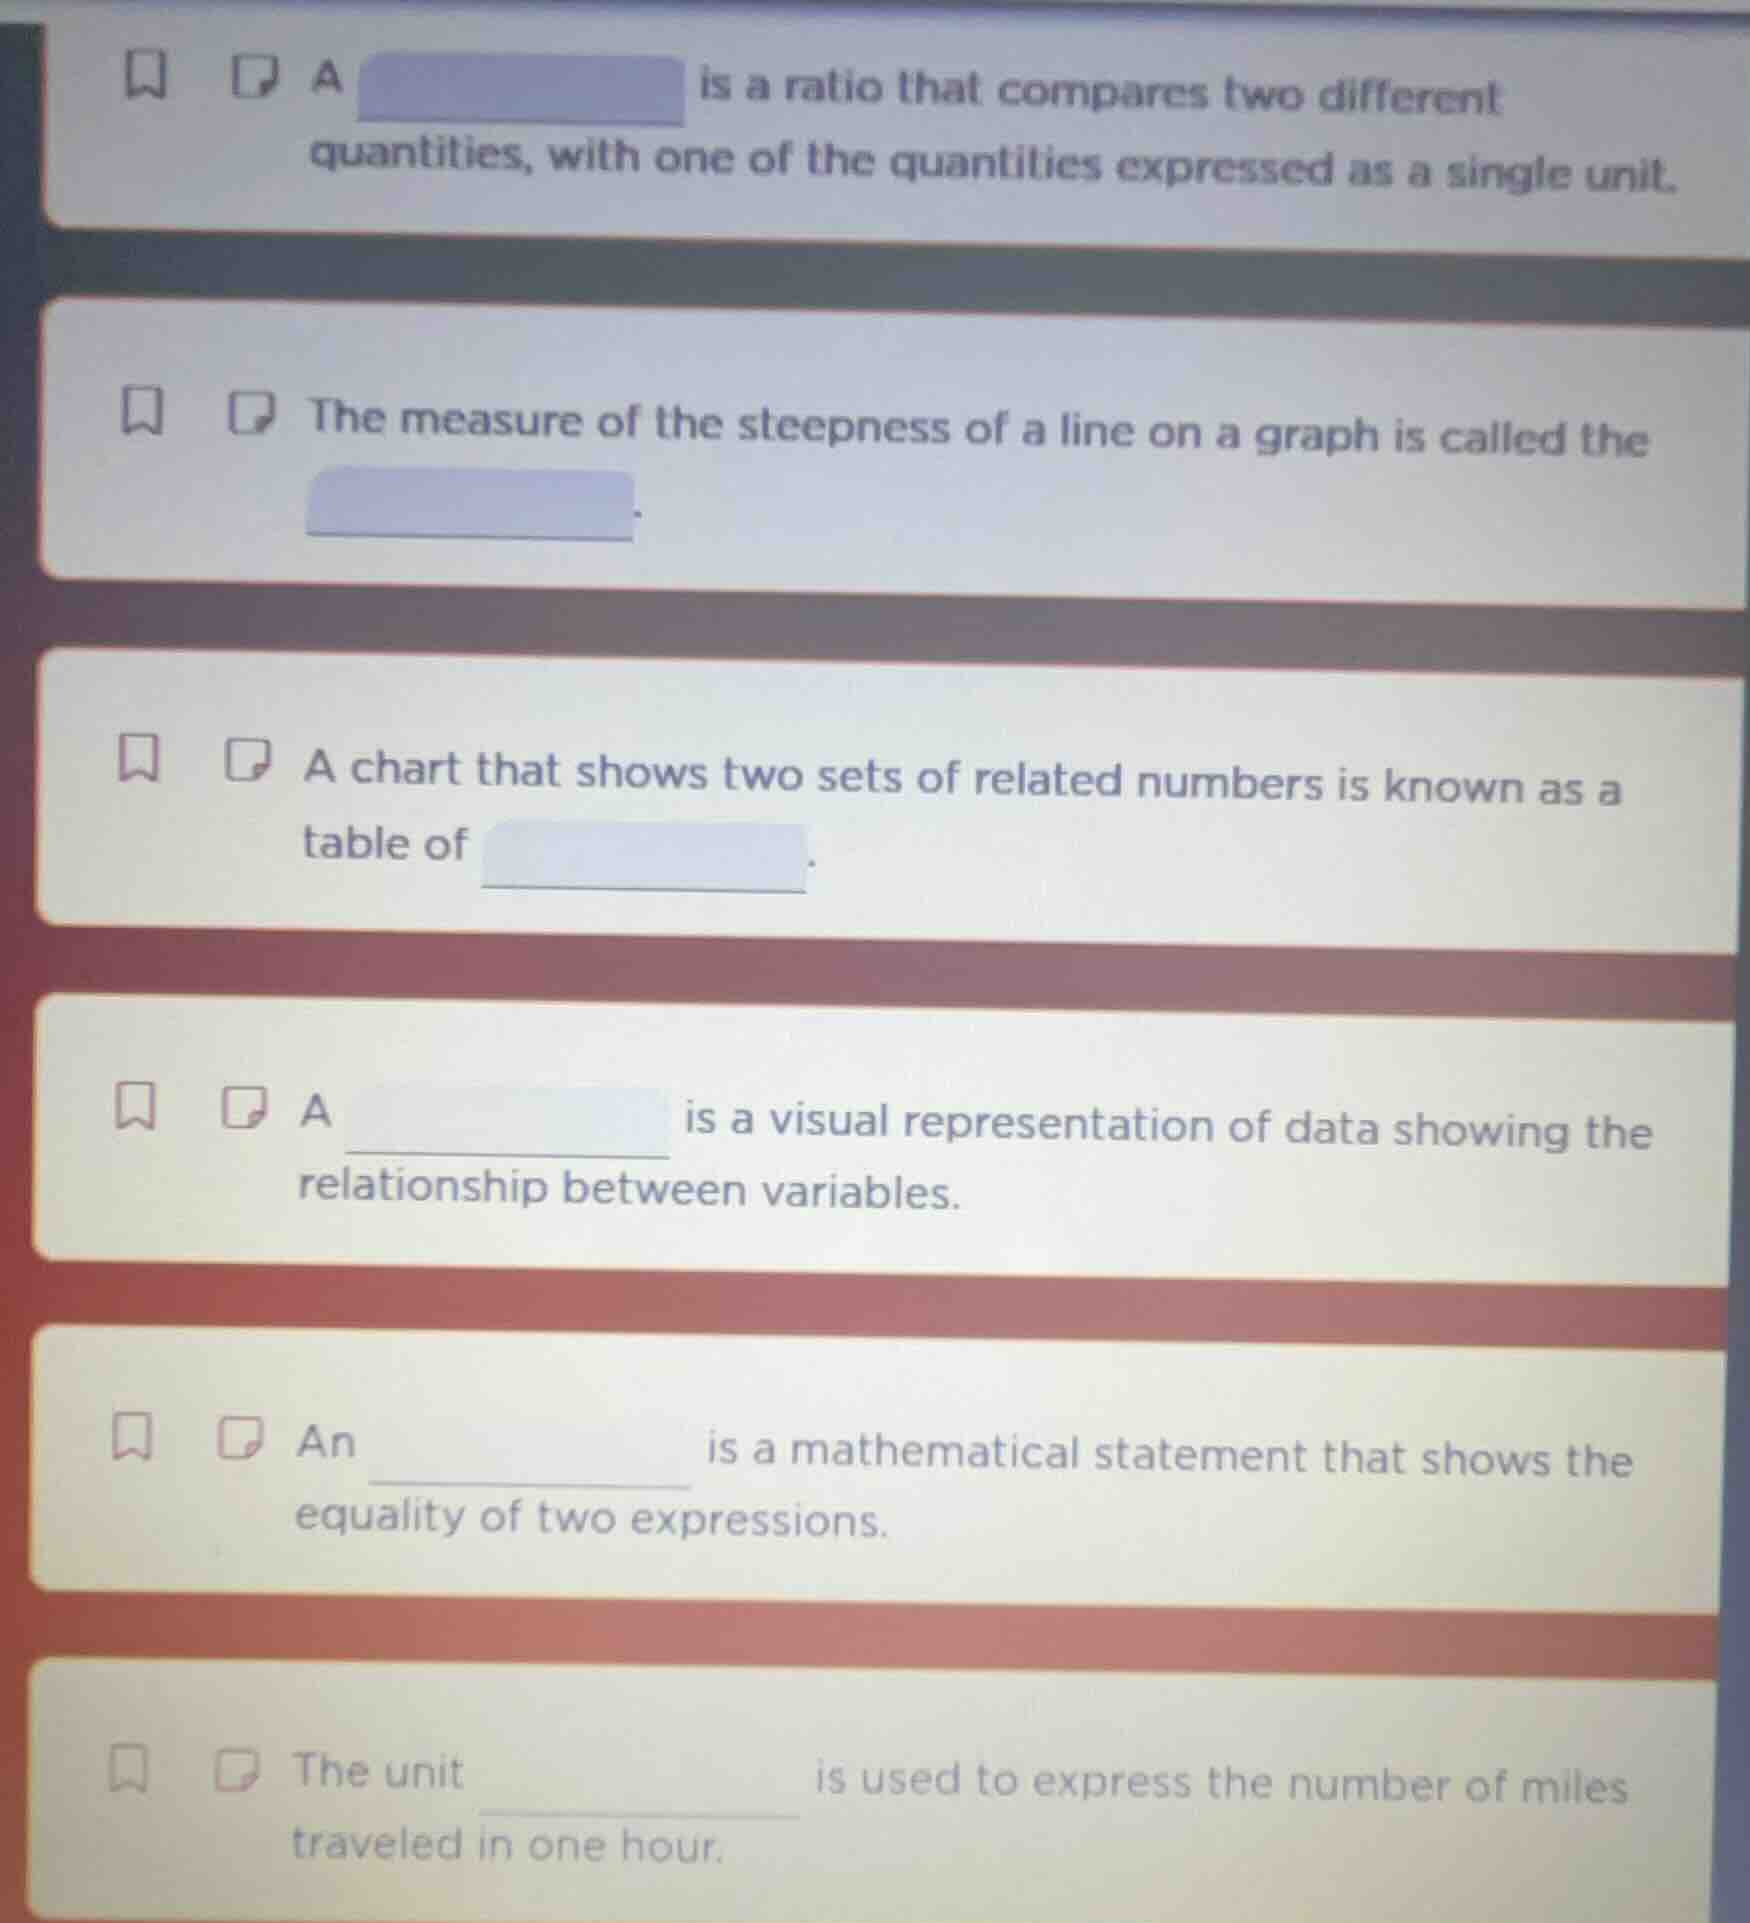
a is a ratio that compares two different quantities, with one of the quantities expressed as a single unit. the measure of the steepness of a line on a graph is called the . a chart that shows two sets of related numbers is known as a table of . a is a visual representation of data showing the relationship between variables. an is a mathematical statement that shows the equality of two expressions. the unit is used to express the number of miles traveled in one hour.
1. First Question
A unit rate is defined as a ratio that compares two different quantities where one quantity is expressed as a single unit (e.g., miles per hour, dollars per item).
In mathematics, the steepness of a line on a graph is measured by its slope. The slope is calculated as the ratio of the vertical change (rise) to the horizontal change (run) between two points on the line.
A table of values is a chart that lists two sets of related numbers (usually corresponding to the input and output of a function or a relationship between two variables). For example, in a linear equation \( y = 2x + 1 \), a table of values might list different \( x \)-values and their corresponding \( y \)-values.

Snap & solve any problem in the app
Get step-by-step solutions on Sovi AI
Photo-based solutions with guided steps
Explore more problems and detailed explanations
unit rate