QUESTION IMAGE
Question
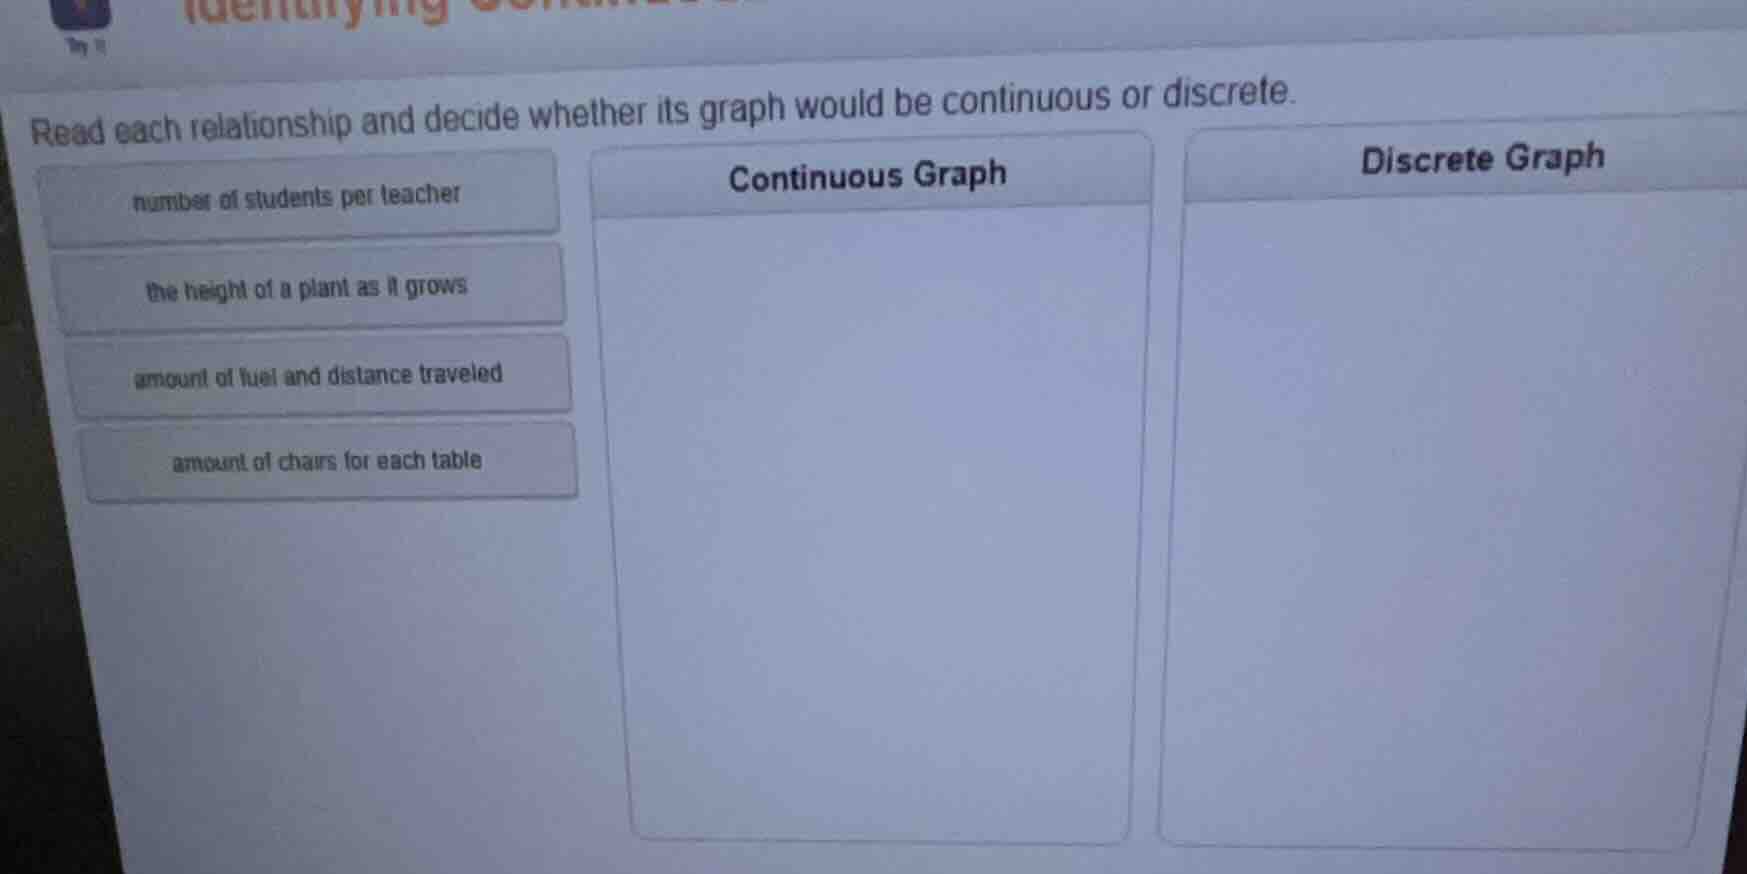
read each relationship and decide whether its graph would be continuous or discrete. number of students per teacher the height of a plant as it grows amount of fuel and distance traveled amount of chairs for each table continuous graph discrete graph
Brief Explanations
Continuous graphs represent data that can take any value within a range (no gaps, measurable). Discrete graphs represent data that can only take specific, separate values (countable, distinct).
- Plant height changes smoothly over time, taking any value in a range.
- Fuel usage and distance traveled have a smooth, measurable relationship (any small amount of fuel used corresponds to a small distance).
- Number of students is a countable, whole number—you can't have a fraction of a student per teacher.
- Number of chairs is a countable, whole number—you can't have a fraction of a chair per table.

Snap & solve any problem in the app
Get step-by-step solutions on Sovi AI
Photo-based solutions with guided steps
Explore more problems and detailed explanations
Continuous Graph
- the height of a plant as it grows
- amount of fuel and distance traveled
Discrete Graph
- number of students per teacher
- amount of chairs for each table