QUESTION IMAGE
Question
read the question below and select the correct answer choice.
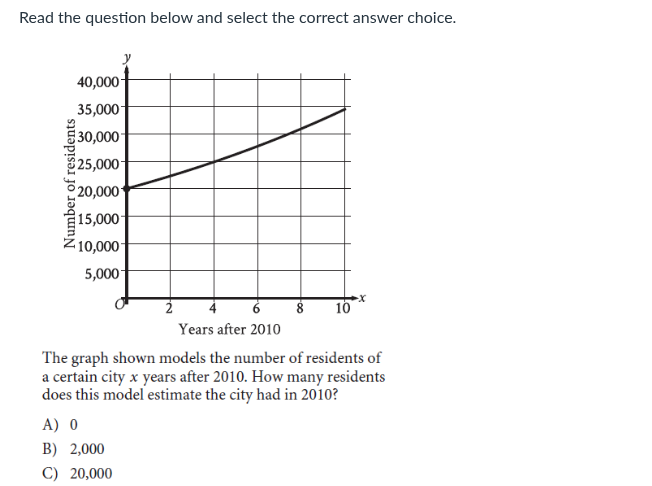
the graph shown models the number of residents of
a certain city ( x ) years after 2010. how many residents
does this model estimate the city had in 2010?
a) 0
b) 2,000
c) 20,000
Step1: Understand the x - axis meaning
The x - axis represents the number of years after 2010. So, when we want to find the number of residents in 2010, we need to find the value of \(y\) when \(x = 0\) (because \(x = 0\) corresponds to 0 years after 2010, i.e., the year 2010).
Step2: Find the y - value at \(x = 0\)
Looking at the graph, when \(x=0\), the \(y\) - value (number of residents) is 20,000.

Snap & solve any problem in the app
Get step-by-step solutions on Sovi AI
Photo-based solutions with guided steps
Explore more problems and detailed explanations
C) 20,000