QUESTION IMAGE
Question
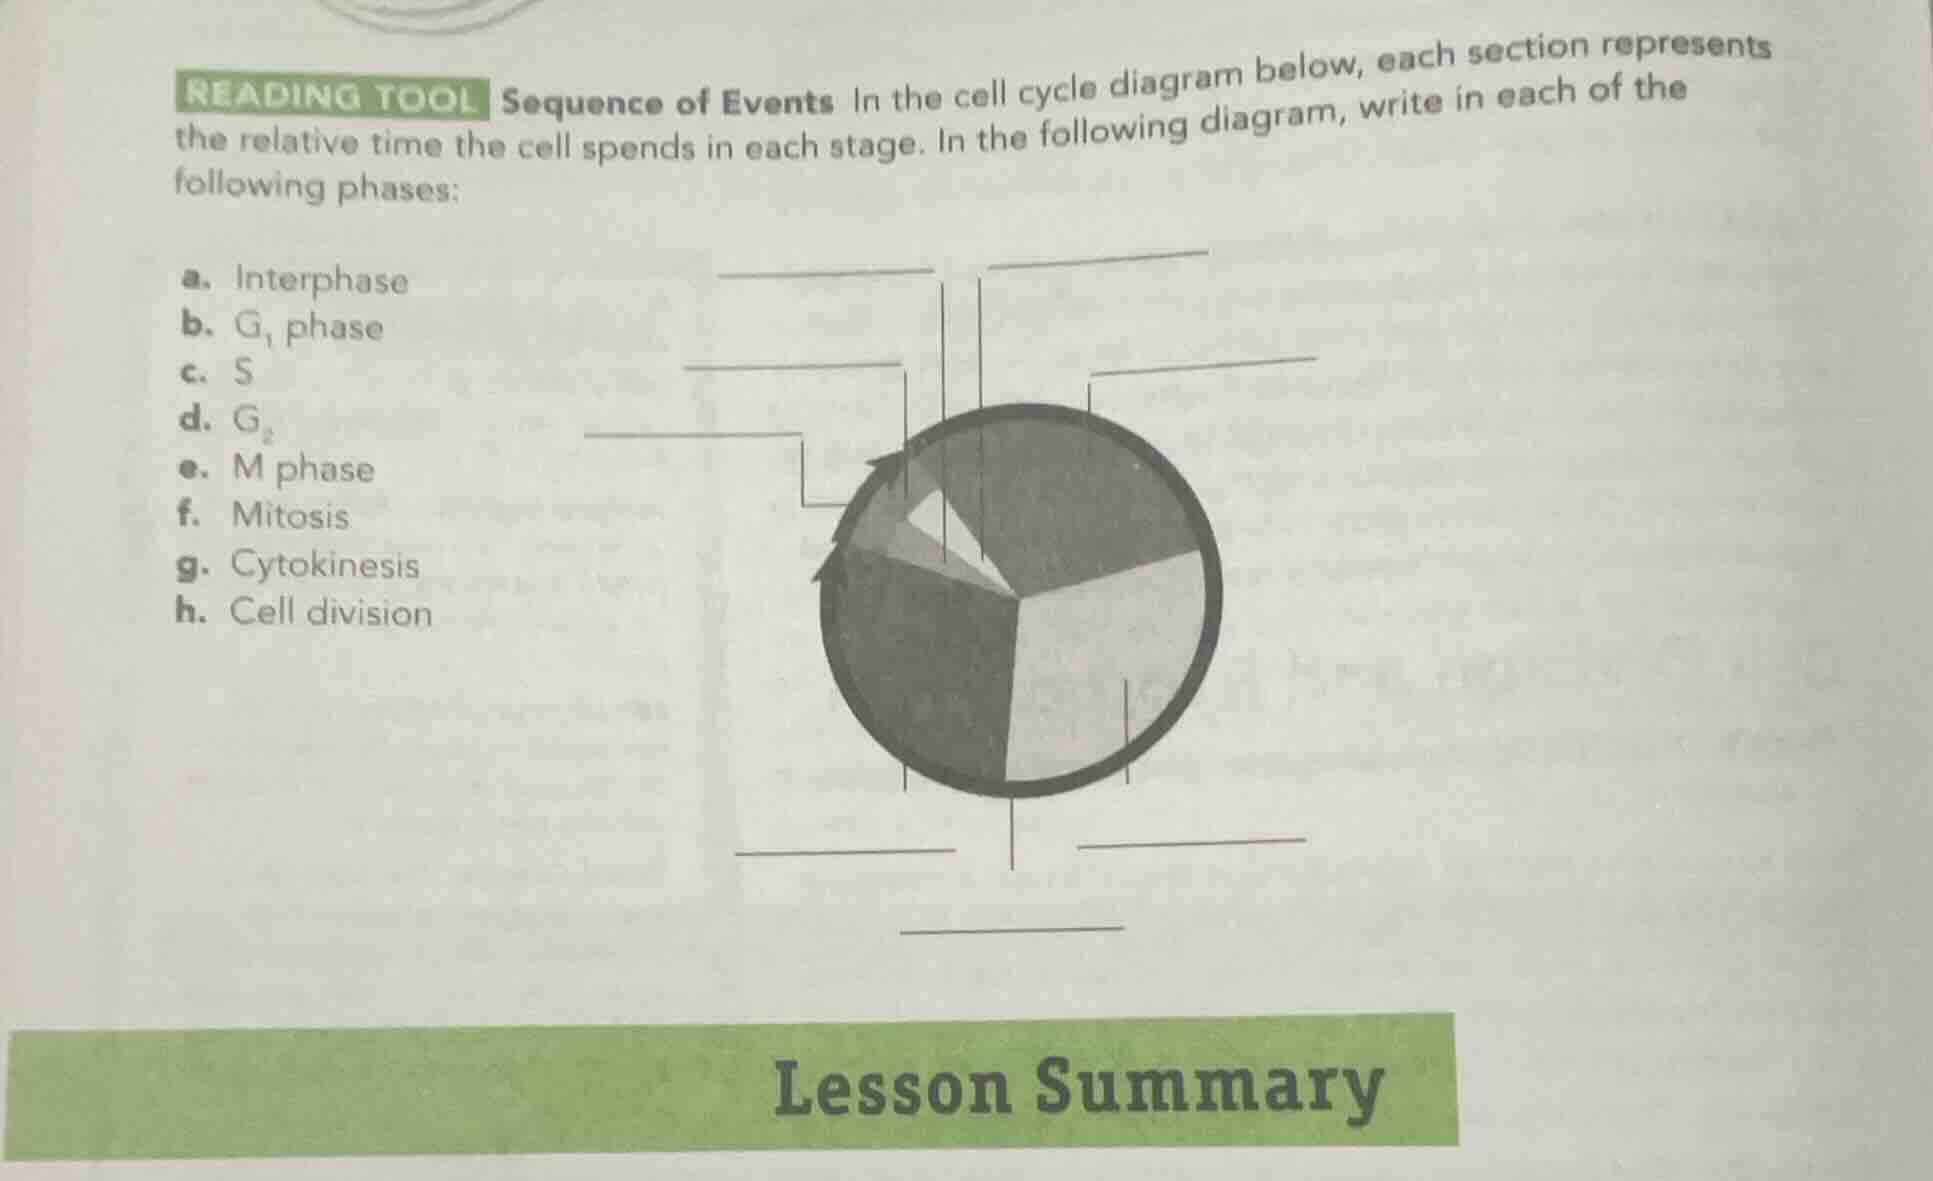
reading tool sequence of events in the cell cycle diagram below, each section represents the relative time the cell spends in each stage. in the following diagram, write in each of the following phases:
a. interphase
b. $g_1$ phase
c. s
d. $g_2$
e. m phase
f. mitosis
g. cytokinesis
h. cell division
lesson summary
The cell cycle's relative time allocations are based on standard biological data: Interphase makes up ~90% of the cycle, split into G₁ (~40%), S (~35%), G₂ (~15%). M phase (cell division) is ~10%, with Mitosis (~8%) and Cytokinesis (~2%) as its sub-stages. The pie chart's largest segments correspond to Interphase sub-stages, and the smallest to M phase components.

Snap & solve any problem in the app
Get step-by-step solutions on Sovi AI
Photo-based solutions with guided steps
Explore more problems and detailed explanations
(Largest dark segment)
- b. G₁ phase: ~40% of cell cycle
(Light large segment)
- c. S phase: ~35% of cell cycle
(Medium dark segment)
- d. G₂ phase: ~15% of cell cycle
(Combined G₁+S+G₂ segments)
- a. Interphase: ~90% of cell cycle
(Smallest segment)
- e. M phase: ~10% of cell cycle
- h. Cell division: ~10% of cell cycle
(Sub-segment of M phase, larger part)
- f. Mitosis: ~8% of cell cycle
(Sub-segment of M phase, smaller part)
- g. Cytokinesis: ~2% of cell cycle