QUESTION IMAGE
Question
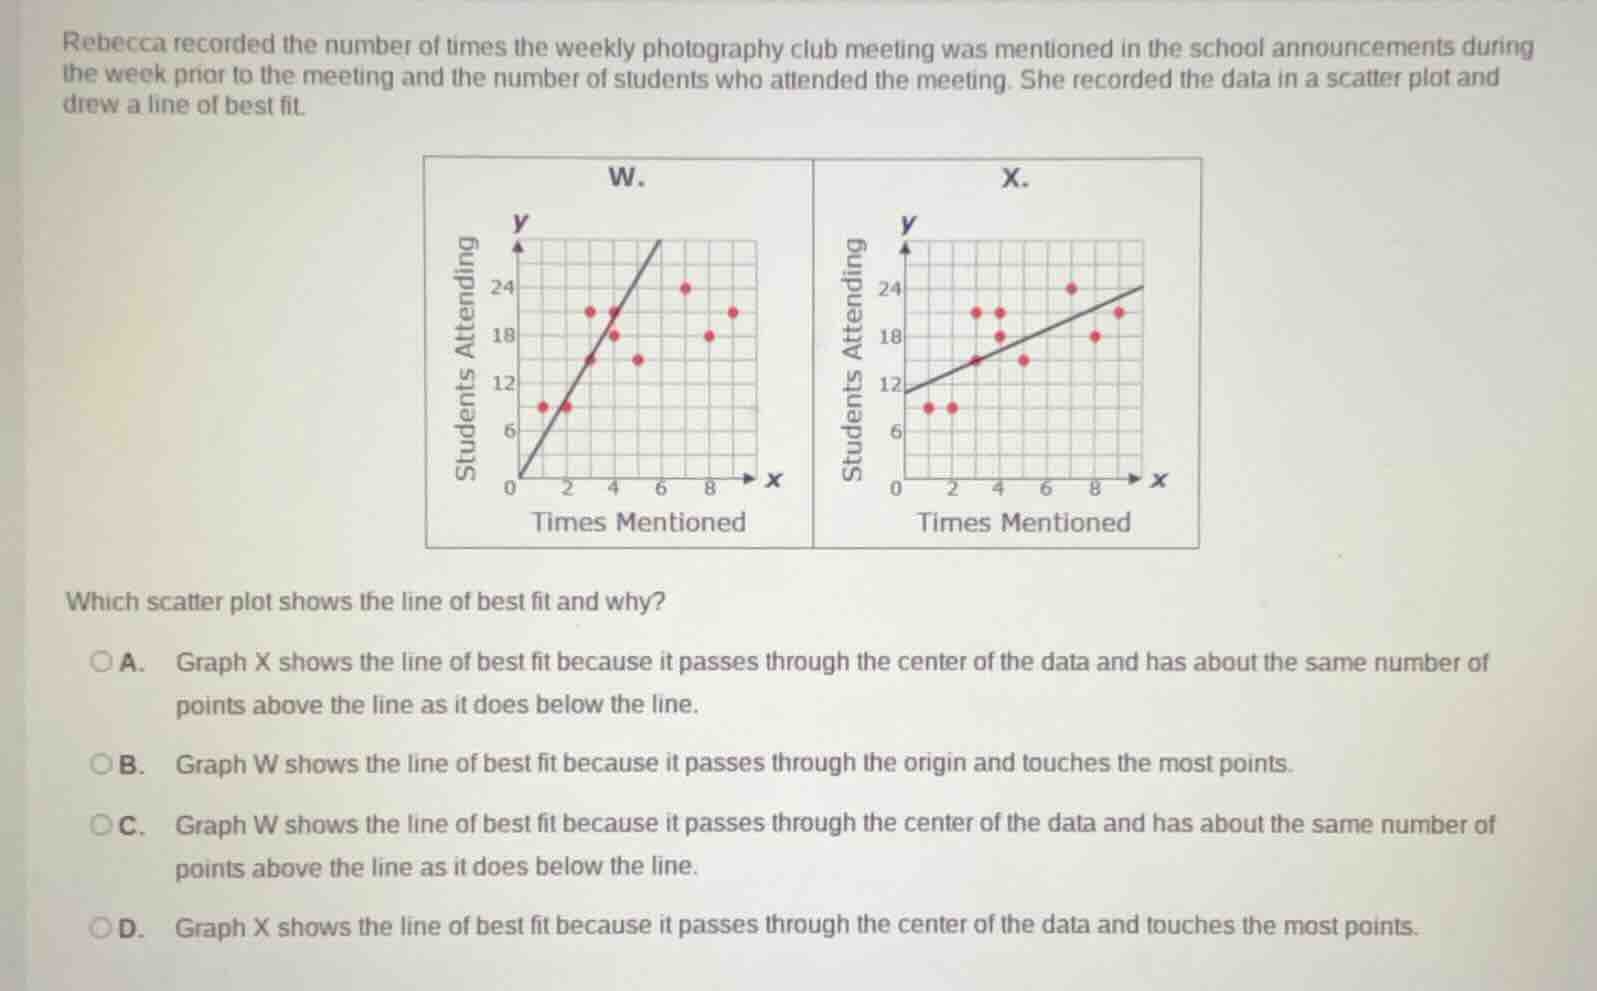
rebecca recorded the number of times the weekly photography club meeting was mentioned in the school announcements during the week prior to the meeting and the number of students who attended the meeting. she recorded the data in a scatter plot and drew a line of best fit.which scatter plot shows the line of best fit and why?a. graph x shows the line of best fit because it passes through the center of the data and has about the same number of points above the line as it does below the line.b. graph w shows the line of best fit because it passes through the origin and touches the most points.c. graph w shows the line of best fit because it passes through the center of the data and has about the same number of points above the line as it does below the line.d. graph x shows the line of best fit because it passes through the center of the data and touches the most points.
A line of best fit for a scatter plot should pass through the center of the data distribution, with approximately an equal number of data points above and below it, rather than touching the most points or passing through the origin. For Graph X, the line aligns with the center of the data, and there are roughly the same number of points above and below it. Graph W's line is too steep, does not center the data, and has an uneven number of points above/below.

Snap & solve any problem in the app
Get step-by-step solutions on Sovi AI
Photo-based solutions with guided steps
Explore more problems and detailed explanations
A. Graph X shows the line of best fit because it passes through the center of the data and has about the same number of points above the line as it does below the line.