QUESTION IMAGE
Question
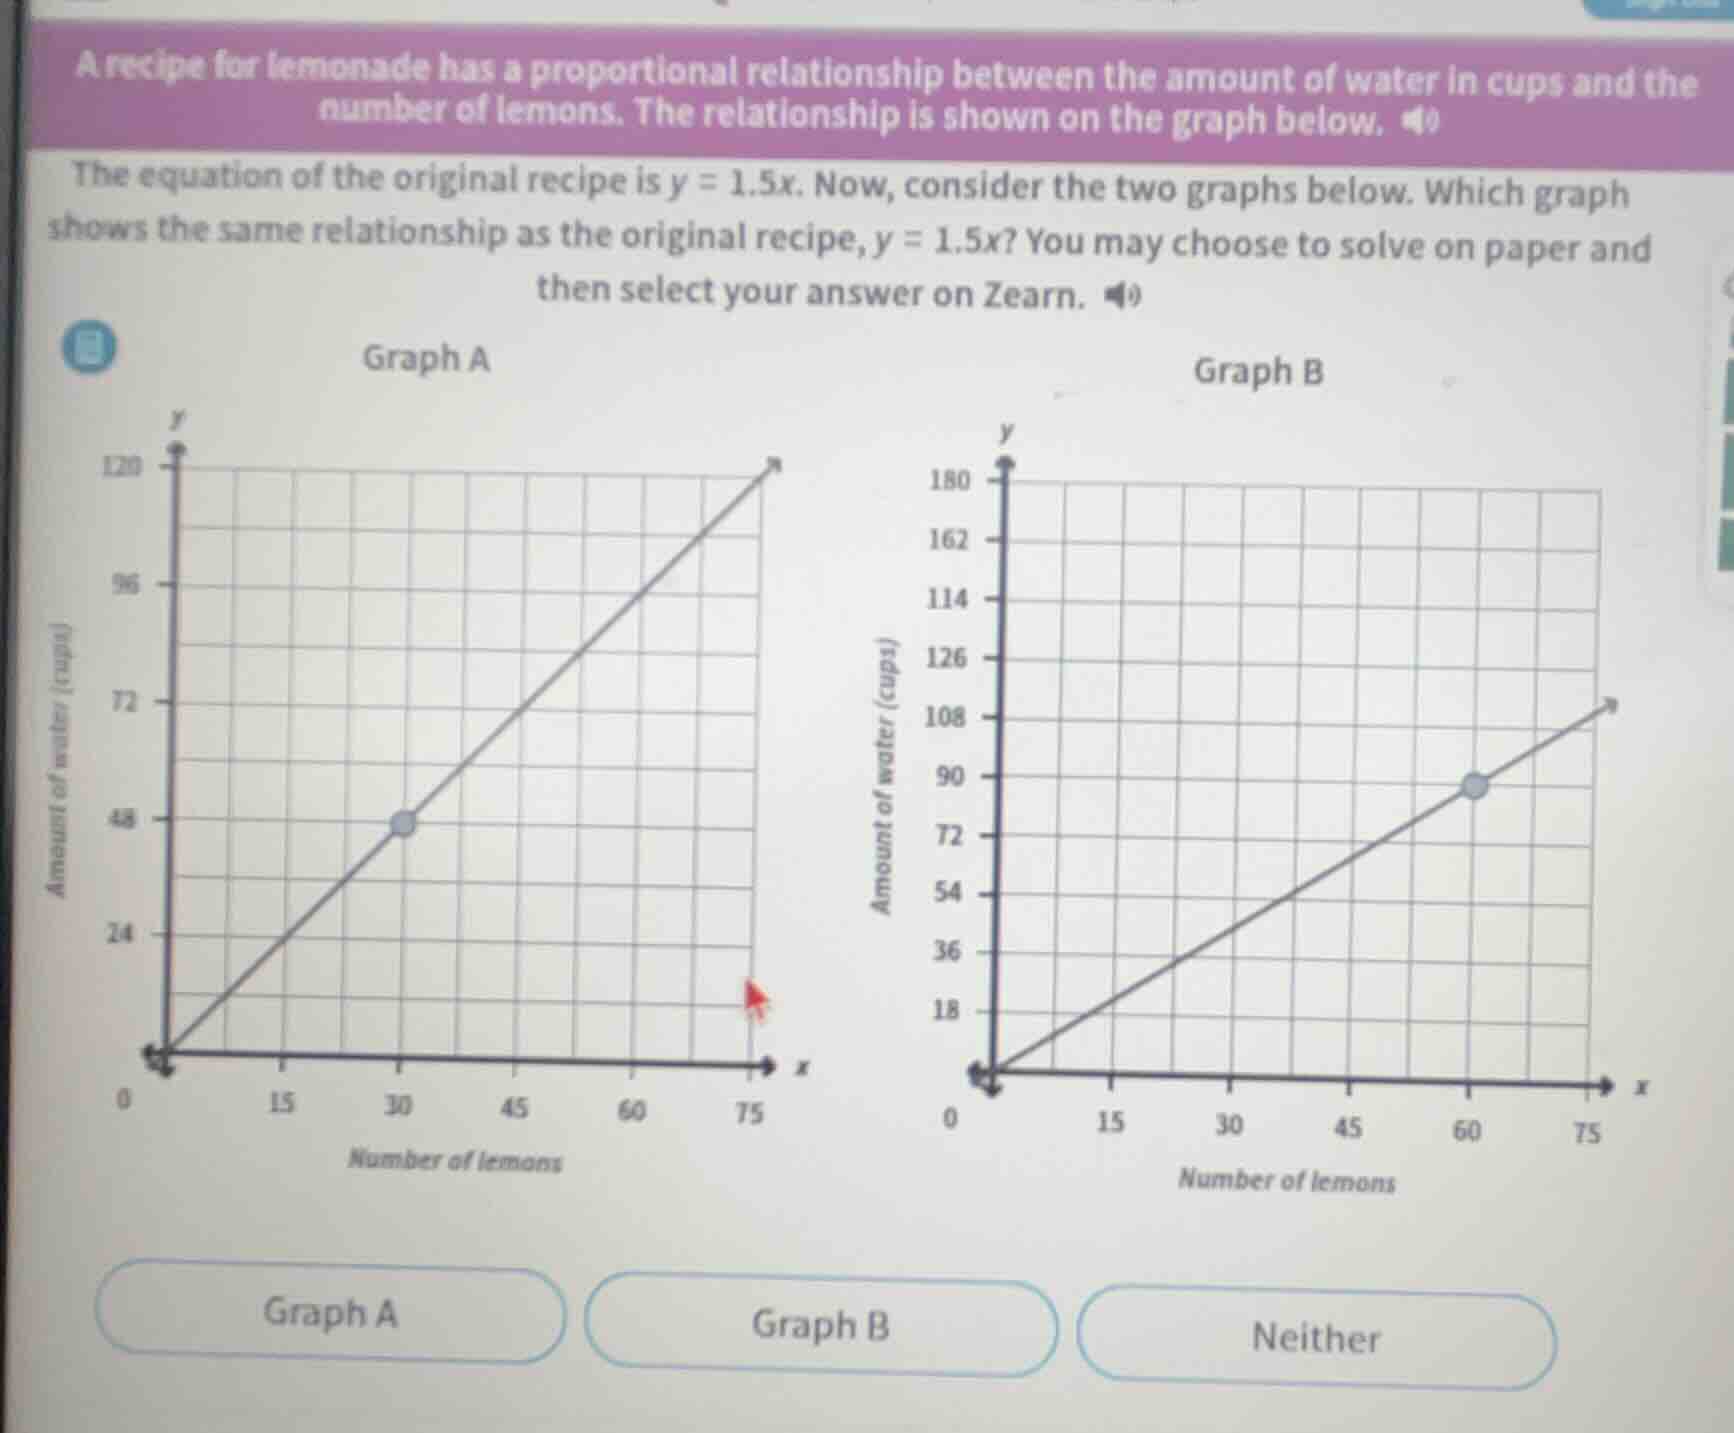
a recipe for lemonade has a proportional relationship between the amount of water in cups and the number of lemons. the relationship is shown on the graph below.the equation of the original recipe is $y = 1.5x$. now, consider the two graphs below. which graph shows the same relationship as the original recipe, $y = 1.5x$? you may choose to solve on paper and then select your answer on zearn.graph agraph bgraph agraph bneither
Step1: Check Graph A's slope
Use the marked point $(30, 48)$. Calculate slope: $\frac{y}{x} = \frac{48}{30} = 1.6$
Step2: Check Graph B's slope
Use the marked point $(60, 90)$. Calculate slope: $\frac{y}{x} = \frac{90}{60} = 1.5$
Step3: Compare to original equation
Original slope is $1.5$, matching Graph B.

Snap & solve any problem in the app
Get step-by-step solutions on Sovi AI
Photo-based solutions with guided steps
Explore more problems and detailed explanations
Graph B