QUESTION IMAGE
Question
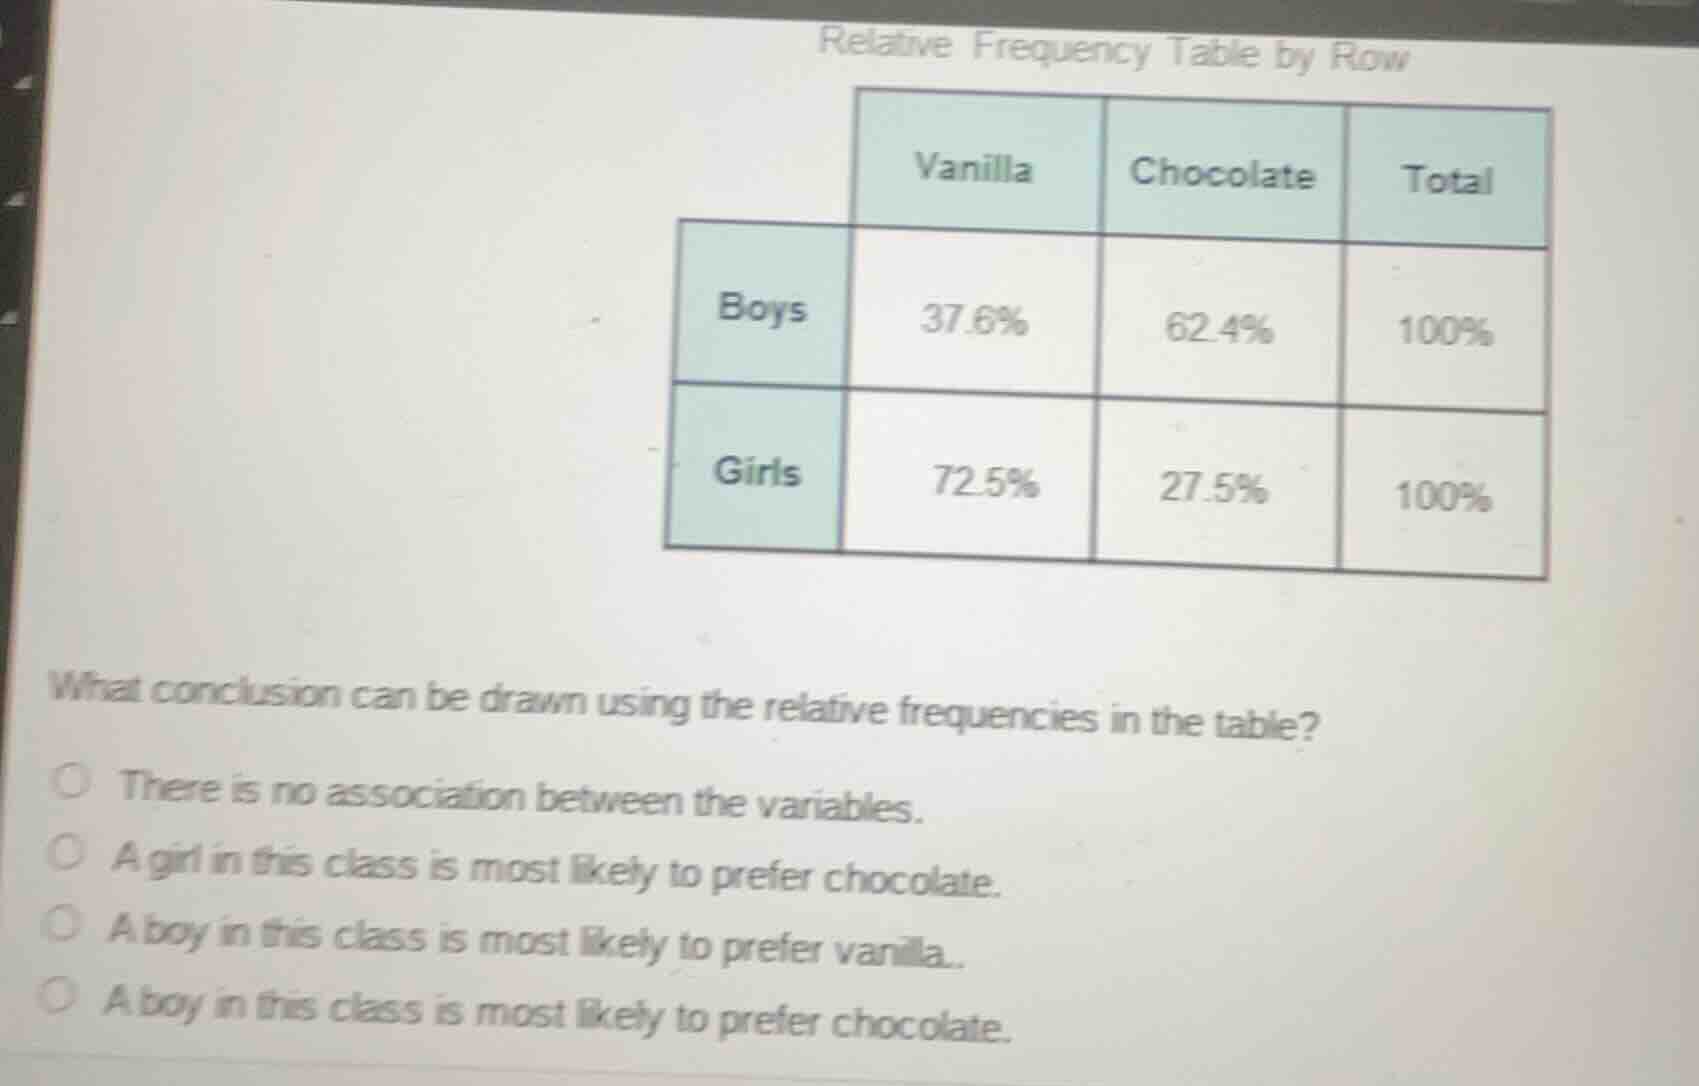
relative frequency table by row
vanilla chocolate total
boys 37.6% 62.4% 100%
girls 72.5% 27.5% 100%
what conclusion can be drawn using the relative frequencies in the table?
○ there is no association between the variables.
○ a girl in this class is most likely to prefer chocolate.
○ a boy in this class is most likely to prefer vanilla..
○ a boy in this class is most likely to prefer chocolate.
Brief Explanations
- Compare boys' preferences: 62.4% (chocolate) > 37.6% (vanilla), so boys favor chocolate.
- Compare girls' preferences: 72.5% (vanilla) > 27.5% (chocolate), so girls favor vanilla.
- Since preferences differ by gender, there is an association between the variables.
- Match this to the given options.

Snap & solve any problem in the app
Get step-by-step solutions on Sovi AI
Photo-based solutions with guided steps
Explore more problems and detailed explanations
A boy in this class is most likely to prefer chocolate.