QUESTION IMAGE
Question
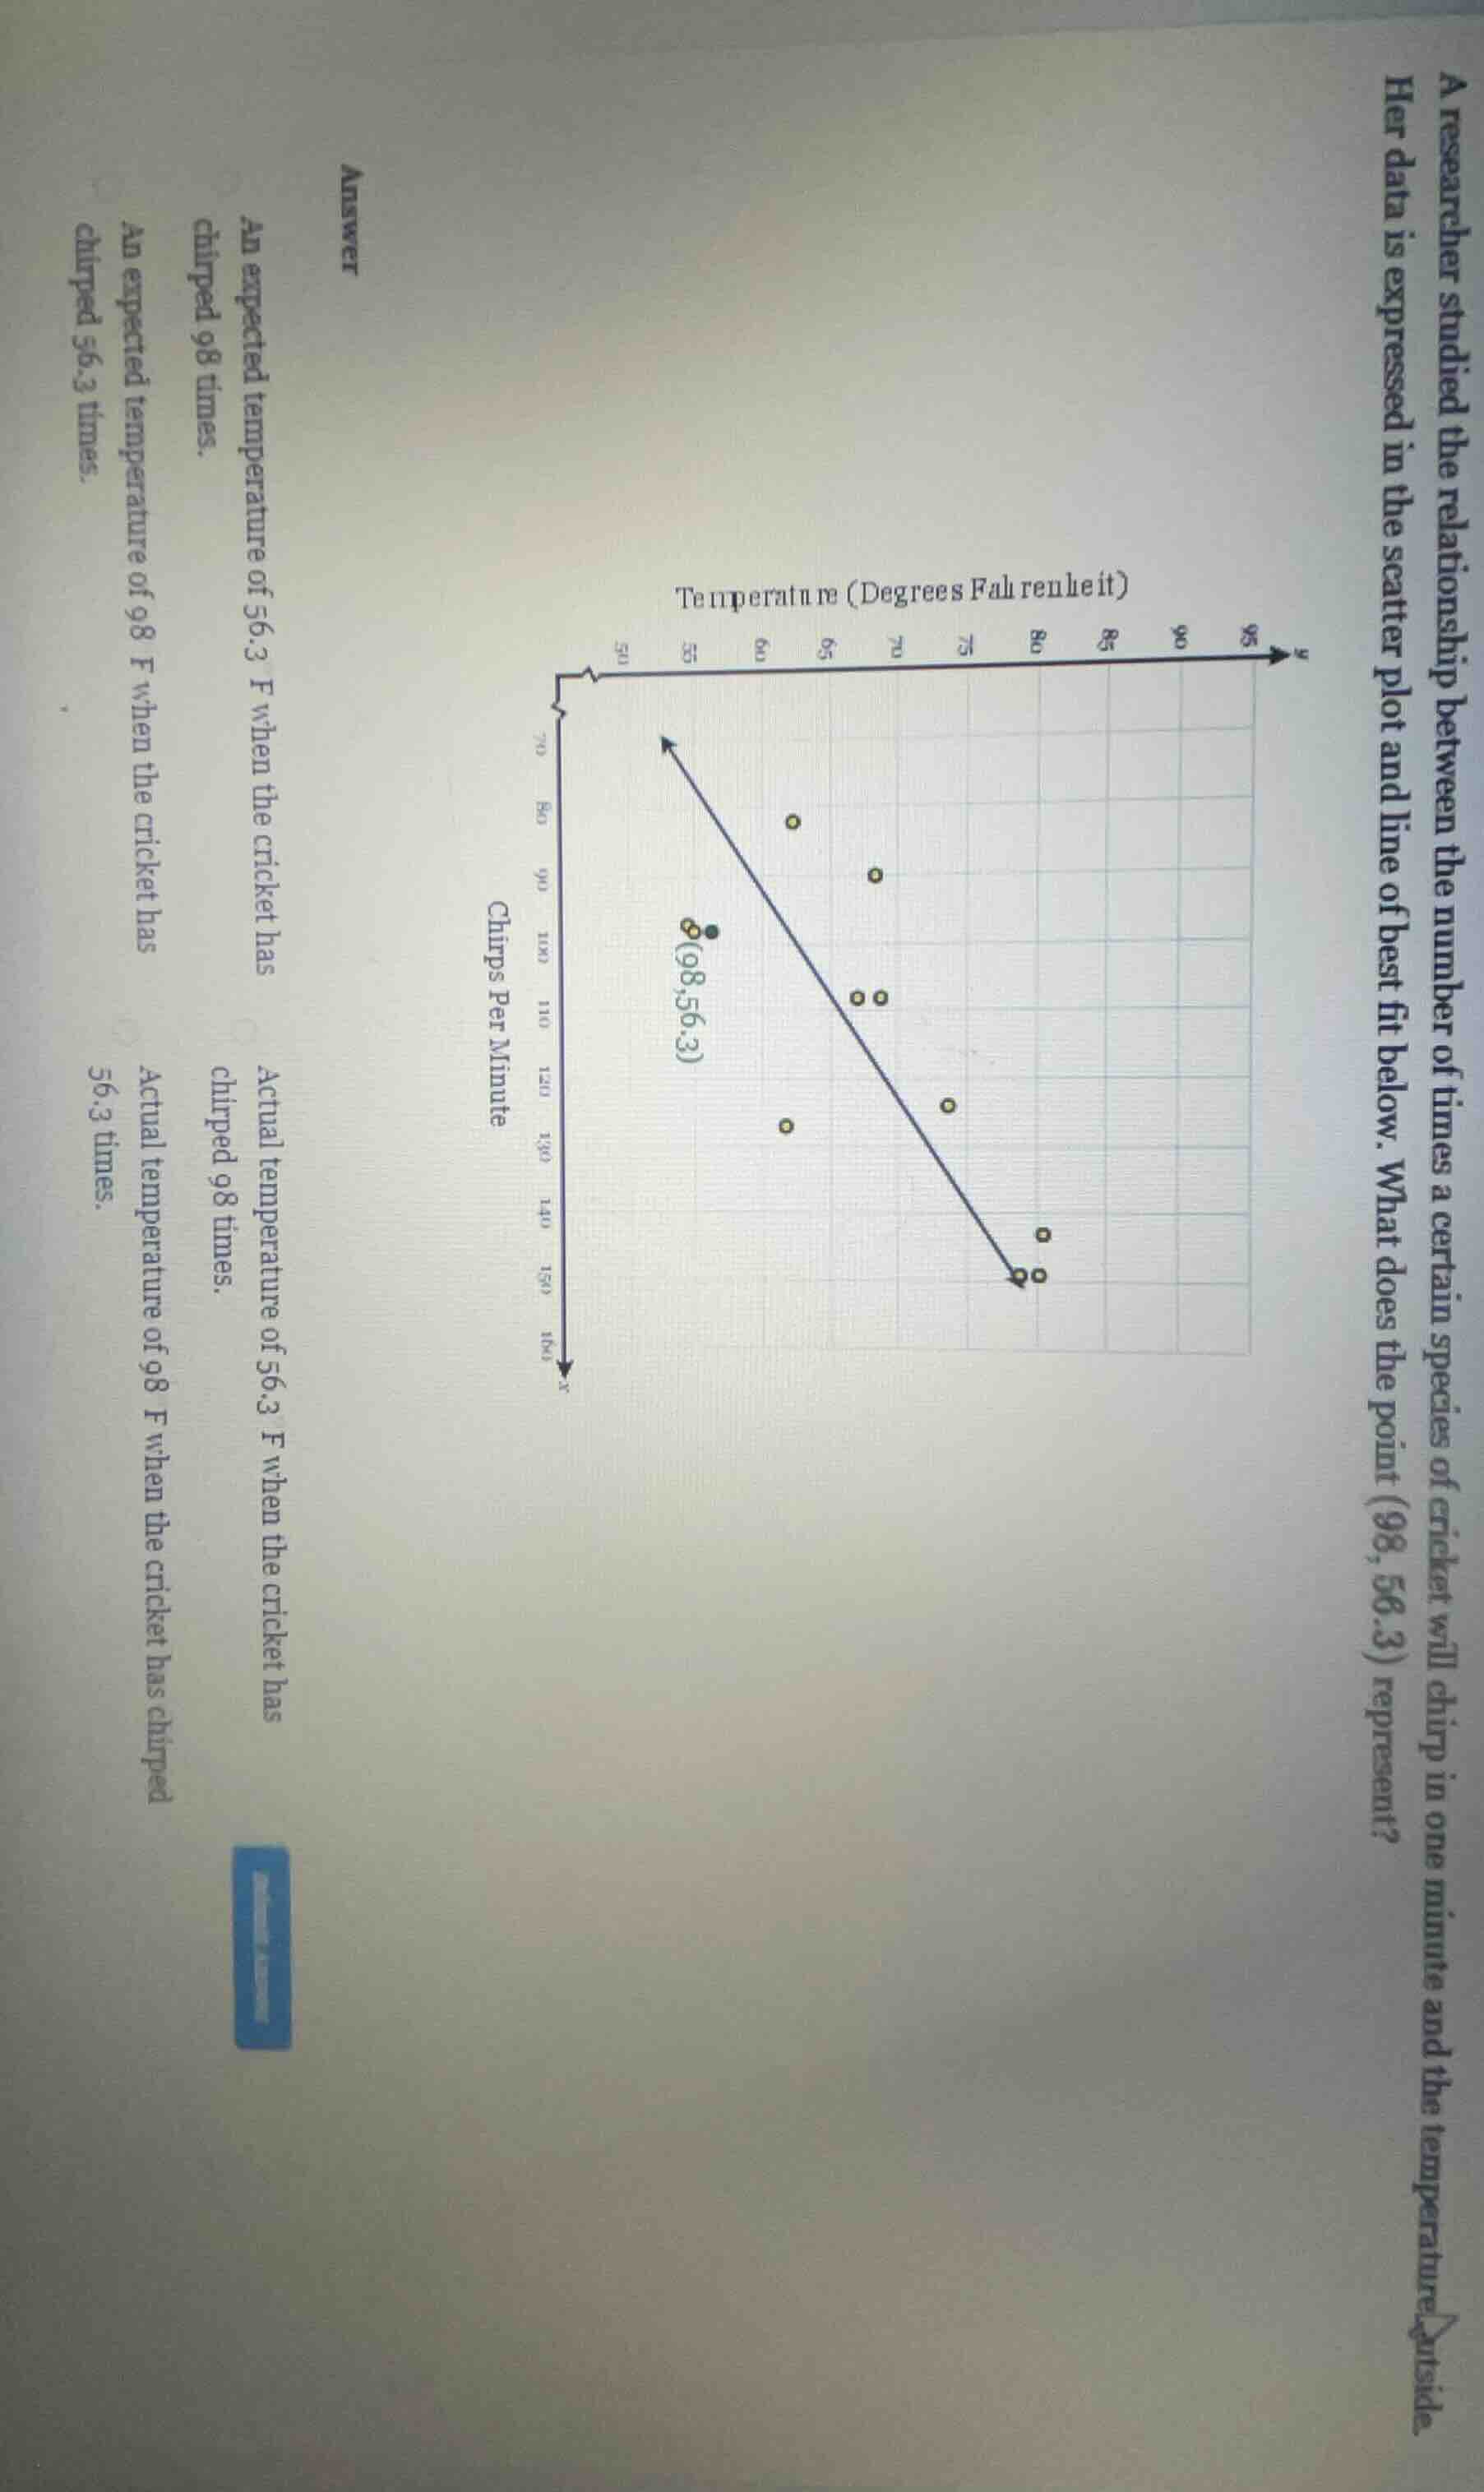
a researcher studied the relationship between the number of times a certain species of cricket will chirp in one minute and the temperature outside. her data is expressed in the scatter plot and line of best fit below. what does the point (98, 56.3) represent?
answer
an expected temperature of 56.3 f when the cricket has chirped 98 times.
actual temperature of 56.3 f when the cricket has chirped 98 times.
an expected temperature of 98 f when the cricket has chirped 56.3 times.
actual temperature of 98 f when the cricket has chirped 56.3 times.
The scatter plot's x-axis is "Chirps Per Minute" and y-axis is "Temperature (Degrees Fahrenheit)". A data point (x,y) here represents the actual observed pair of values: x is the number of chirps in a minute, y is the corresponding outside temperature.

Snap & solve any problem in the app
Get step-by-step solutions on Sovi AI
Photo-based solutions with guided steps
Explore more problems and detailed explanations
Actual temperature of 56.3 F when the cricket has chirped 98 times.