QUESTION IMAGE
Question
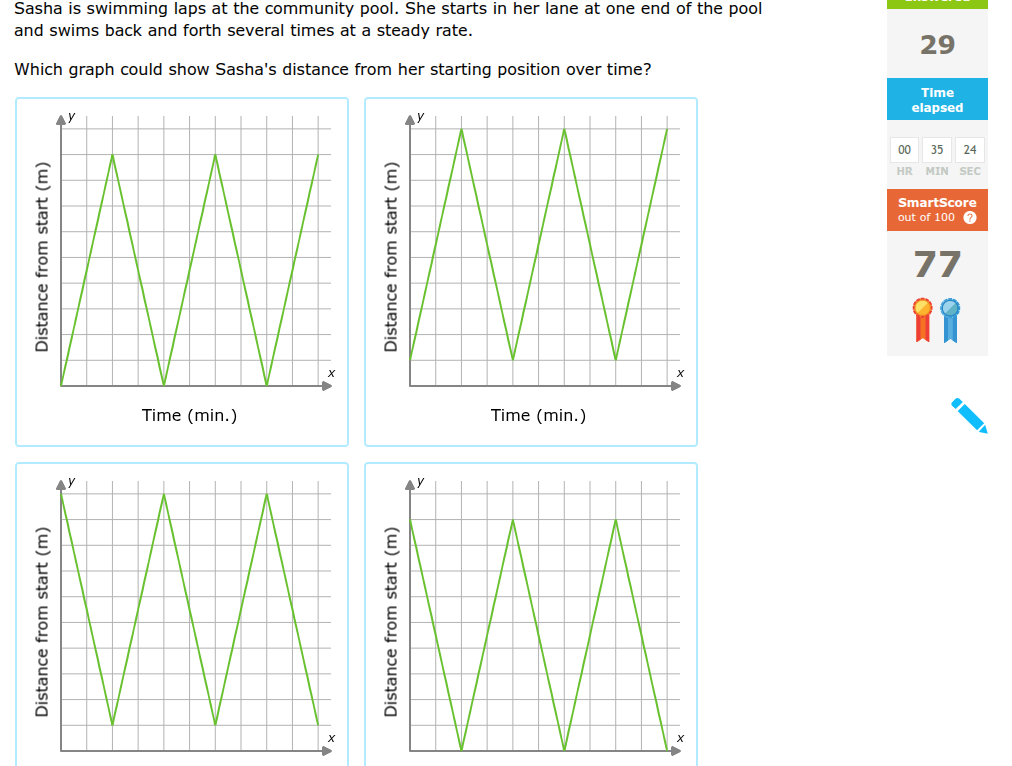
sasha is swimming laps at the community pool. she starts in her lane at one end of the pool and swims back and forth several times at a steady rate. which graph could show sashas distance from her starting position over time?
Brief Explanations
Sasha starts at one end of the pool, so her initial distance from the starting position should be 0. Let's analyze each graph:
- The first graph: At time = 0, distance from start is 0 (starts at the end). When she swims to the other end, distance increases to the pool's length, then swims back to start (distance 0), and repeats. This matches her motion (starts at start, swims back and forth).
- The second graph: Initial distance is not 0, so incorrect.
- The third and fourth graphs: Initial distance is at the pool's length (starts at the other end), but she starts at one end (so initial distance should be 0), so incorrect.

Snap & solve any problem in the app
Get step-by-step solutions on Sovi AI
Photo-based solutions with guided steps
Explore more problems and detailed explanations
The first graph (top - left)