QUESTION IMAGE
Question
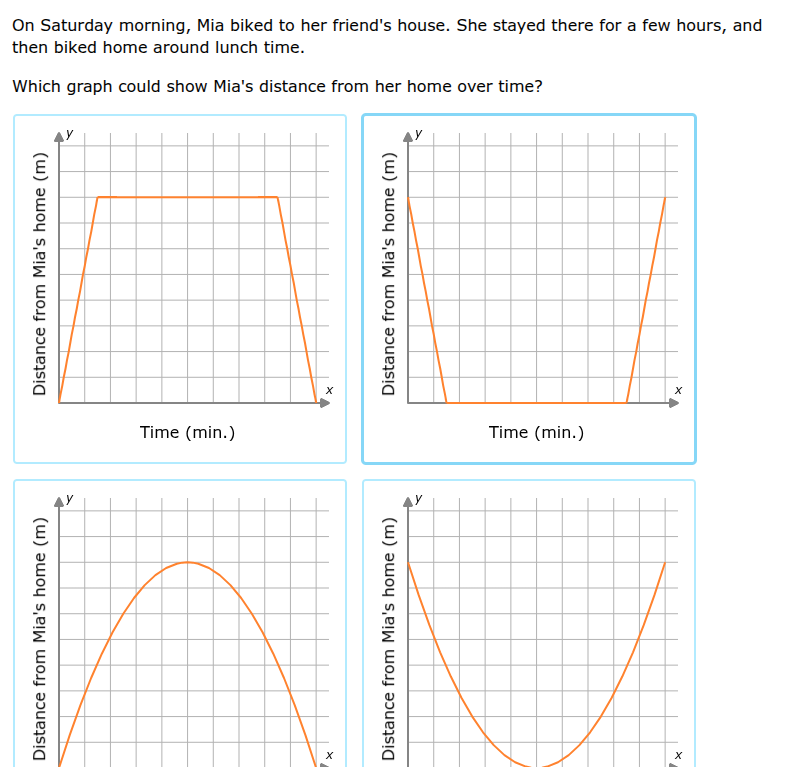
on saturday morning, mia biked to her friends house. she stayed there for a few hours, and then biked home around lunch time. which graph could show mias distance from her home over time?
Step1: Analyze Mia's journey
Mia starts at home, so initial distance from home is 0. She bikes to her friend's house, so distance from home increases until she reaches her friend's house. Then she stays there for a few hours, so distance remains constant (horizontal line) during that time. After that, she bikes home, so distance decreases back to 0.
Step2: Evaluate each graph
- First graph: Starts at 0 (home), distance increases (biking to friend's), then constant (staying), then decreases to 0 (biking home). This matches.
- Second graph: Starts with non - zero distance, then decreases to 0 (opposite of starting from home), so incorrect.
- Third graph: Distance first increases, then decreases without a constant period (no staying at friend's), incorrect.
- Fourth graph: Distance first decreases, then increases (opposite of Mia's journey), incorrect.

Snap & solve any problem in the app
Get step-by-step solutions on Sovi AI
Photo-based solutions with guided steps
Explore more problems and detailed explanations
The first graph (top - left) which has a line starting at the origin, increasing to a constant value, then decreasing back to the x - axis.