QUESTION IMAGE
Question
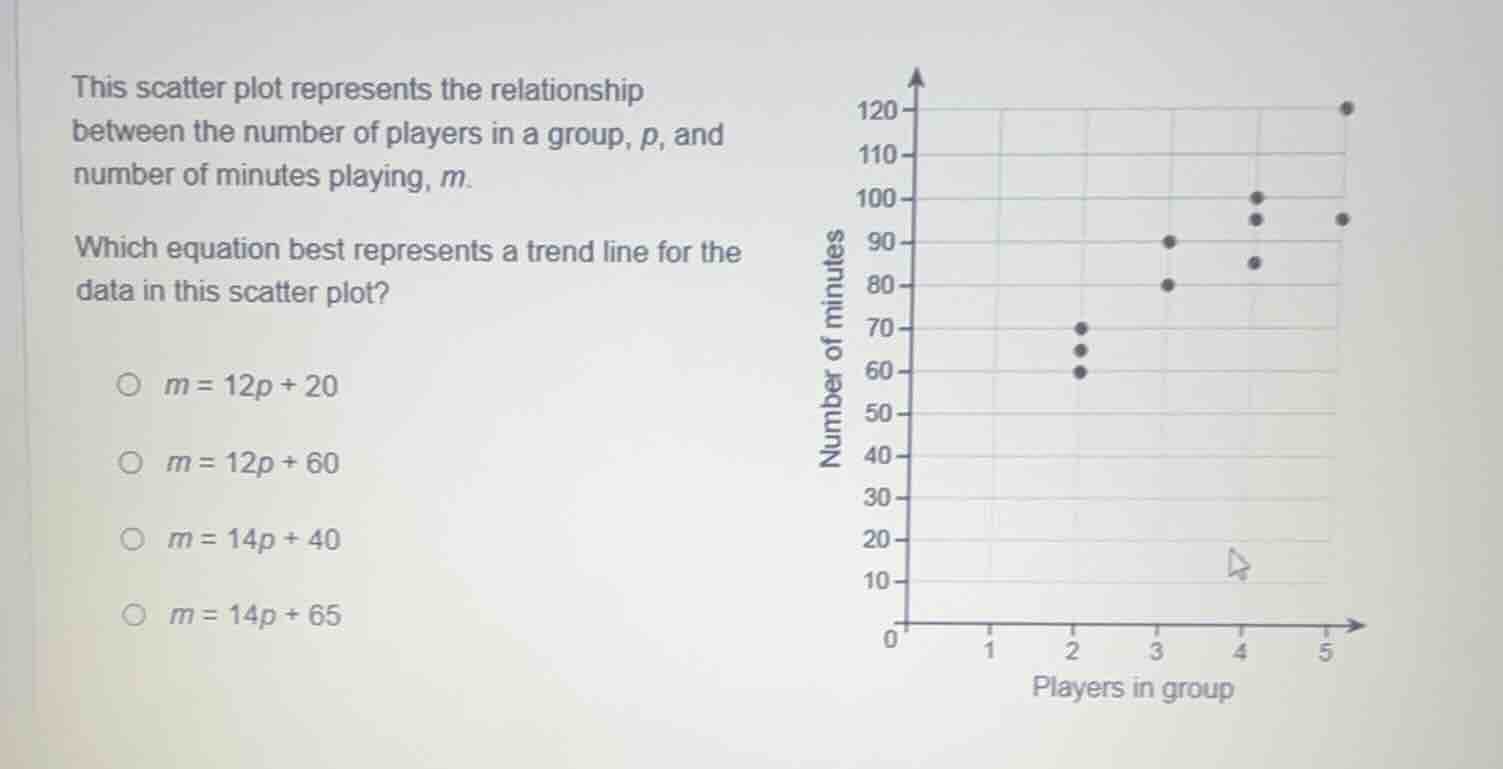
this scatter plot represents the relationship between the number of players in a group, p, and number of minutes playing, m. which equation best represents a trend line for the data in this scatter plot? 〇 $m = 12p + 20$ 〇 $m = 12p + 60$ 〇 $m = 14p + 40$ 〇 $m = 14p + 65$
Step1: Analyze the scatter plot's trend
We can pick two points on the trend line (approximate). Let's take \( p = 2 \), \( m\approx65 \) and \( p = 5 \), \( m\approx120 \).
Step2: Calculate the slope (\(k\))
The slope formula is \( k=\frac{m_2 - m_1}{p_2 - p_1} \). Substituting \( (p_1,m_1)=(2,65) \) and \( (p_2,m_2)=(5,120) \), we get \( k=\frac{120 - 65}{5 - 2}=\frac{55}{3}\approx18.33 \)? Wait, no, maybe better to use the options. Let's check the y - intercept. When \( p = 2 \), for option \( m = 12p+20 \), \( m = 12*2 + 20=44 \), too low. For \( m = 12p + 60 \), \( m=12*2+60 = 84 \), no. Wait, maybe my point selection is wrong. Let's take \( p = 2 \), the points are around 60 - 70. For \( m = 14p+40 \), \( p = 2 \), \( m=14*2 + 40=68 \), close. \( p = 3 \), \( m = 14*3+40 = 82 \), close to the 80 - 90 range. \( p = 4 \), \( m=14*4 + 40=96 \), close to 90 - 100. \( p = 5 \), \( m=14*5+40 = 110 \), close to 120? Wait, no, the top point at \( p = 5 \) is 120. Wait, maybe another approach. Let's check the slope between \( p = 2 \) (m ~ 65) and \( p = 5 \) (m ~ 120). Slope \(=\frac{120 - 65}{5 - 2}=\frac{55}{3}\approx18.33 \), but the options have 12 and 14. Wait, maybe I made a mistake. Let's check the options again. Wait, when \( p = 2 \), the average m is around 65. For \( m = 14p+40 \), \( p = 2 \), \( m = 28 + 40=68 \) (close to 65 - 70). \( p = 3 \), \( m=14*3 + 40=82 \), which is close to the 80 - 90 range. \( p = 4 \), \( m=14*4+40 = 96 \), close to 90 - 100. \( p = 5 \), \( m=14*5 + 40=110 \), and the top point at \( p = 5 \) is 120, which is a bit high, but maybe. Wait, no, the option \( m = 14p + 40 \): when \( p = 2 \), 68; \( p = 3 \), 82; \( p = 4 \), 96; \( p = 5 \), 110. The points at \( p = 3 \) are around 80 - 90, 82 is close. At \( p = 4 \), 96 is close to 90 - 100. At \( p = 2 \), 68 is close to the 60 - 70 range. Let's check \( m = 14p+40 \) vs \( m = 14p + 65 \). For \( p = 2 \), \( 14*2+65 = 93 \), too high. So \( m = 14p + 40 \) is better. Wait, but let's check the slope again. The difference in p from 2 to 5 is 3, difference in m from ~65 to ~120 is 55, slope ~18, but the options have 12 and 14. Wait, maybe my initial point is wrong. Let's take \( p = 2 \), m ~ 65; \( p = 3 \), m ~ 80. Slope \(=\frac{80 - 65}{3 - 2}=15 \), close to 14. So \( m = 14p + b \). When \( p = 2 \), \( 65=14*2 + b \), \( b=65 - 28 = 37 \), close to 40. So \( m = 14p + 40 \) is the best fit.

Snap & solve any problem in the app
Get step-by-step solutions on Sovi AI
Photo-based solutions with guided steps
Explore more problems and detailed explanations
\( \boldsymbol{m = 14p + 40} \) (the option corresponding to this equation)