QUESTION IMAGE
Question
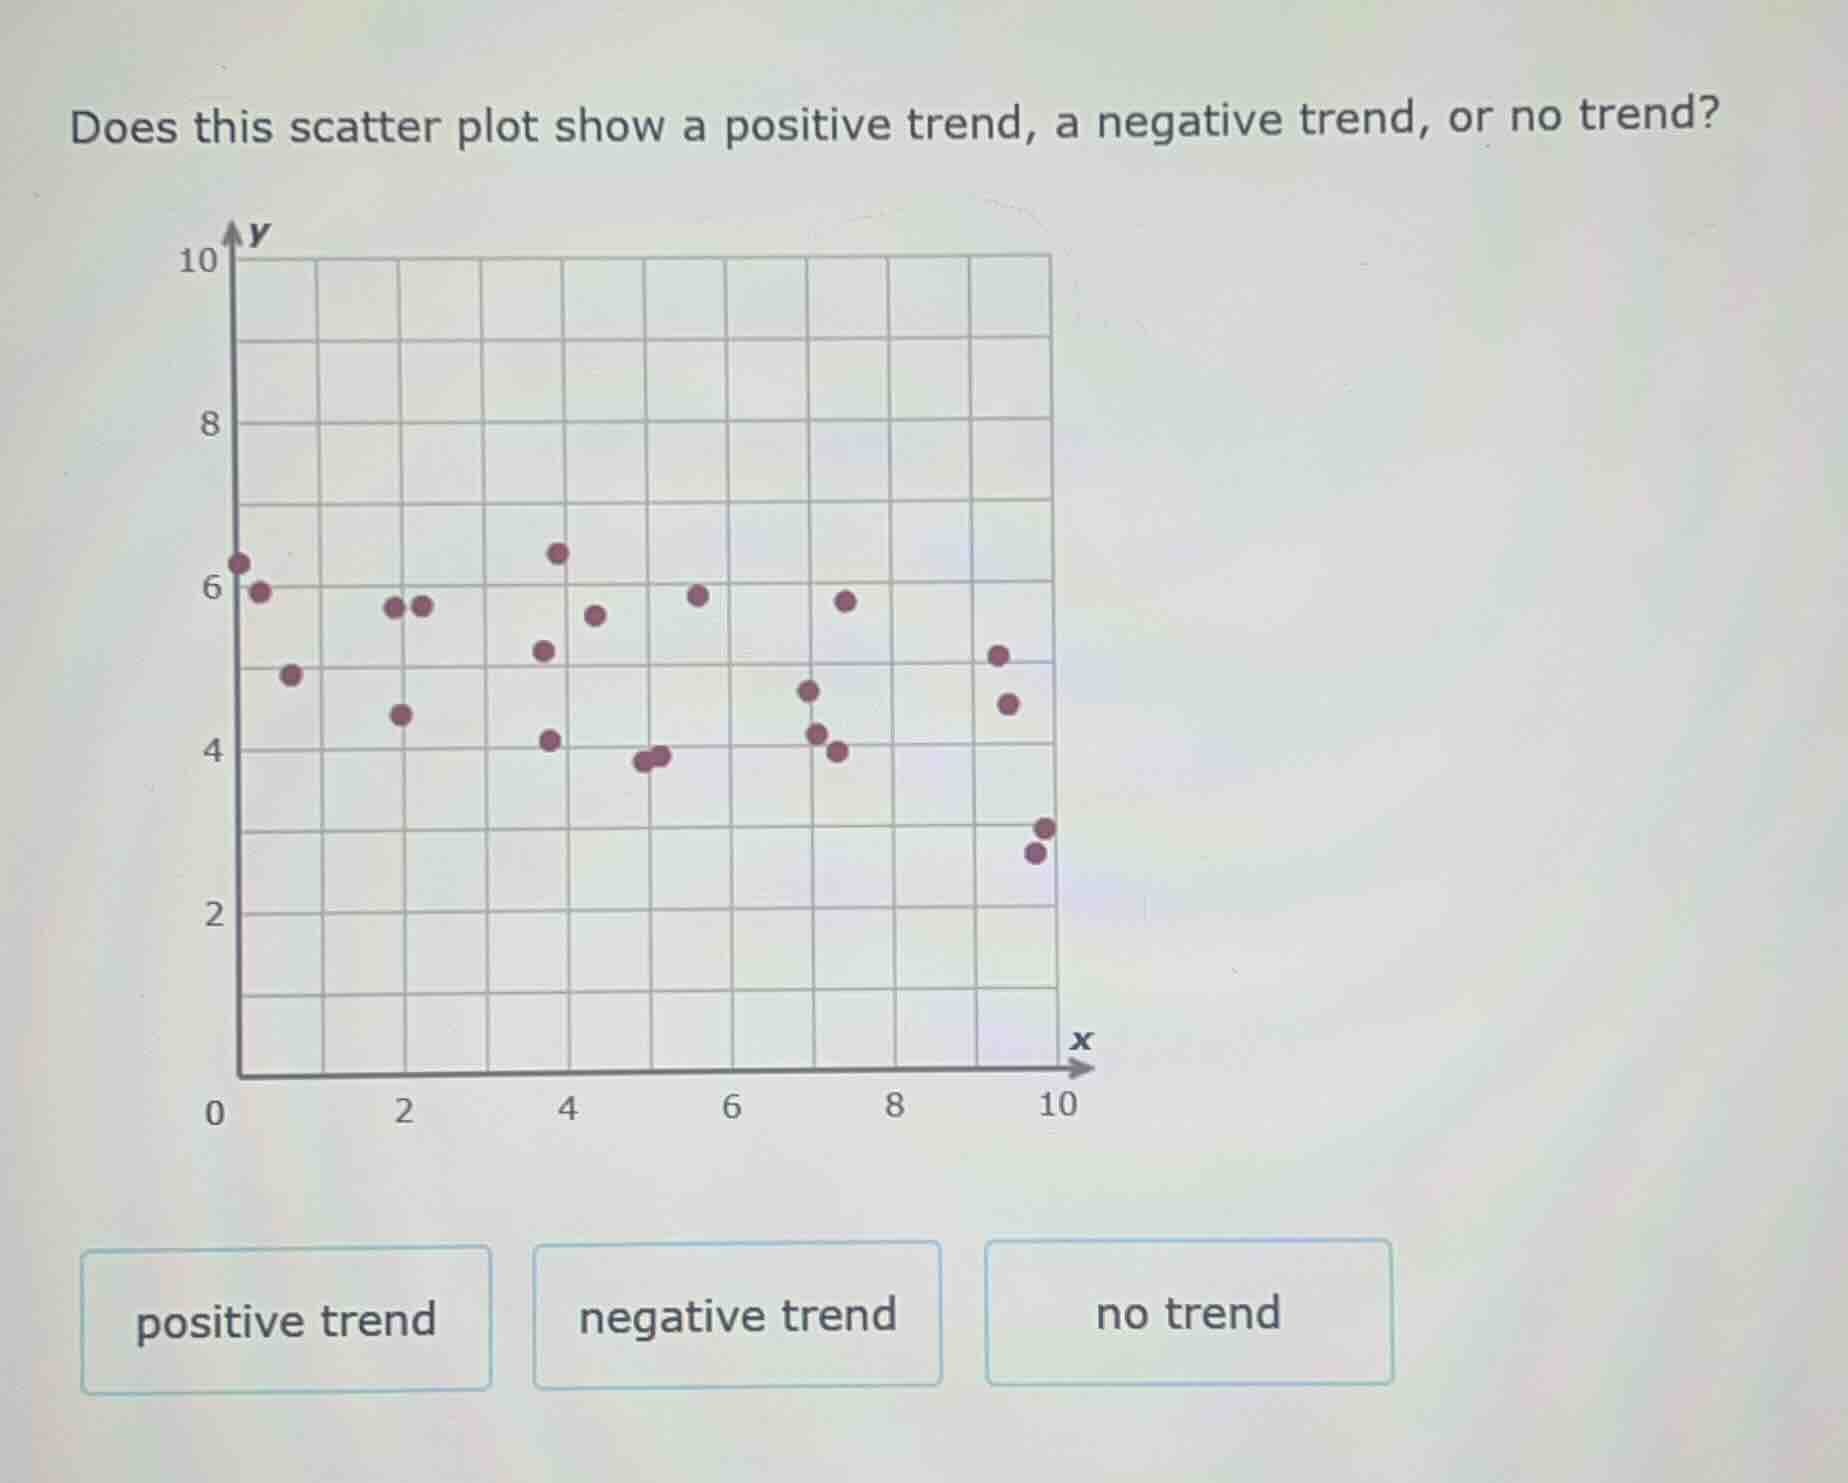
does this scatter plot show a positive trend, a negative trend, or no trend? positive trend negative trend no trend
Brief Explanations
A negative trend in a scatter plot occurs when as the x-value increases, the y-value tends to decrease. Observing the plot, as x moves from 0 to 10, the overall pattern of data points shifts downward, showing y-values generally decrease with higher x-values.

Snap & solve any problem in the app
Get step-by-step solutions on Sovi AI
Photo-based solutions with guided steps
Explore more problems and detailed explanations
negative trend