QUESTION IMAGE
Question
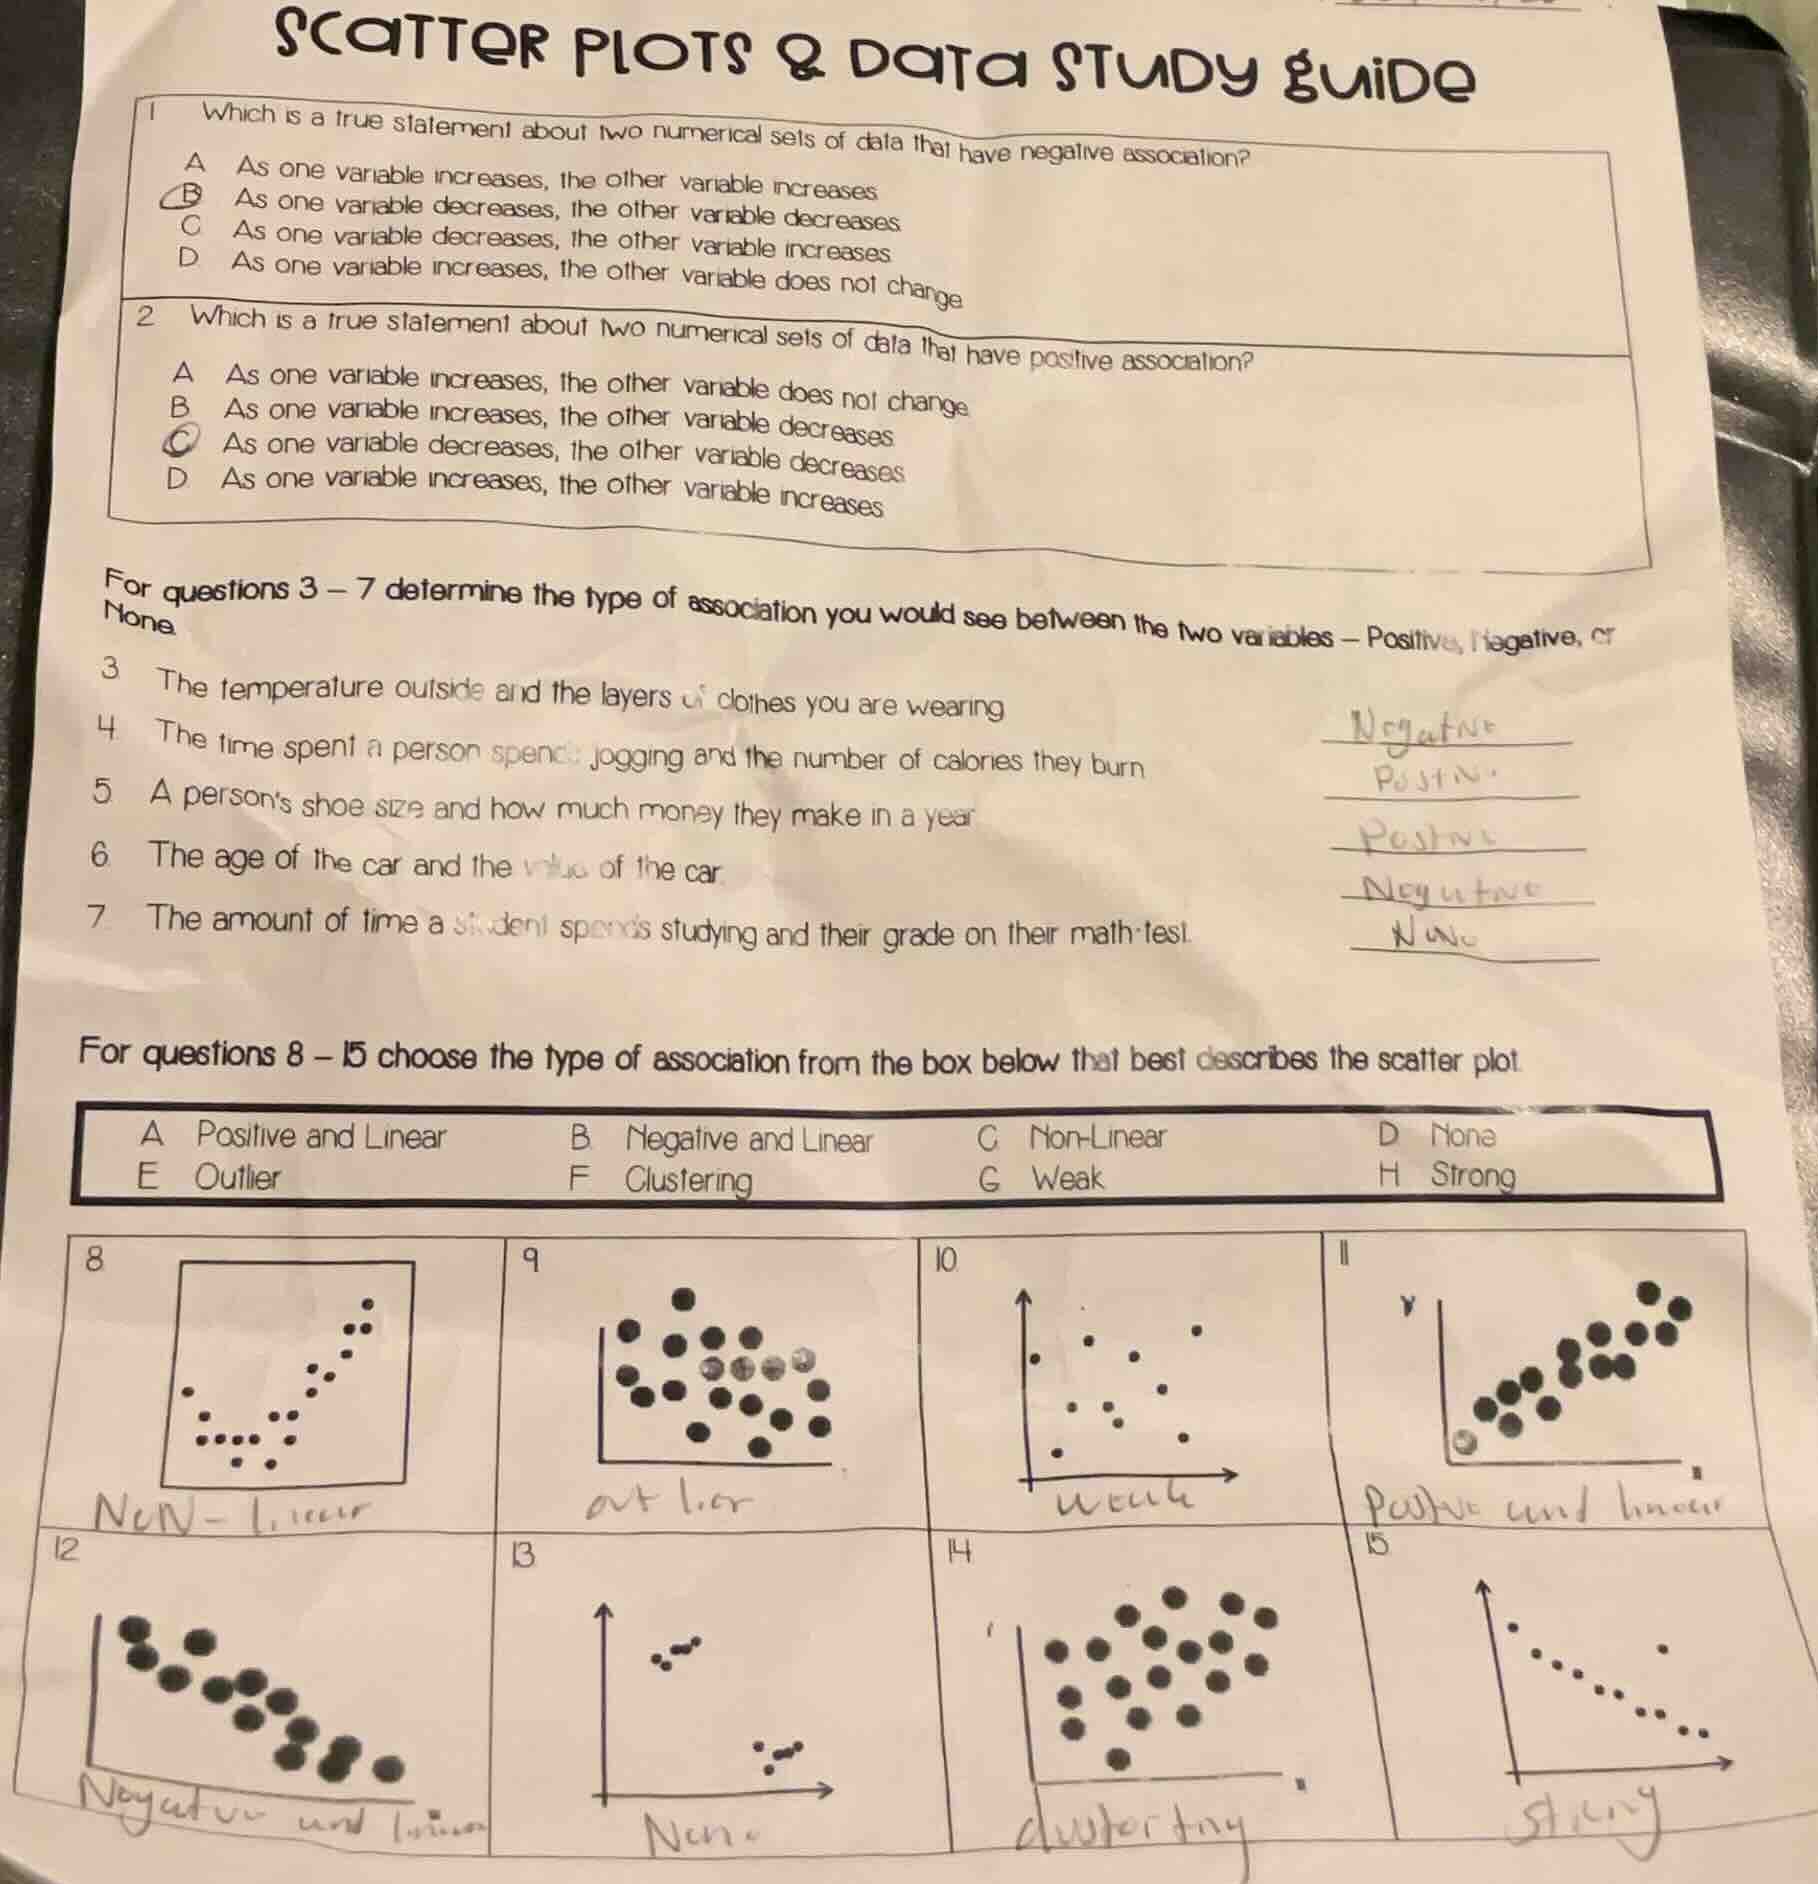
scatter plots & data study guide
1 which is a true statement about two numerical sets of data that have negative association?
a as one variable increases, the other variable increases
b as one variable decreases, the other variable decreases
c as one variable decreases, the other variable increases
d as one variable increases, the other variable does not change
2 which is a true statement about two numerical sets of data that have positive association?
a as one variable increases, the other variable does not change
b as one variable increases, the other variable decreases
c as one variable decreases, the other variable decreases
d as one variable increases, the other variable increases
for questions 3 – 7 determine the type of association you would see between the two variables – positive, negative, or none
3 the temperature outside and the layers of clothes you are wearing
4 the time spent a person spends jogging and the number of calories they burn
5 a persons shoe size and how much money they make in a year
6 the age of the car and the value of the car
7 the amount of time a student spends studying and their grade on their math test
for questions 8 – 15 choose the type of association from the box below that best describes the scatter plot.
a positive and linear b negative and linear c non - linear d none
e outlier f clustering g weak h strong
Step1: Analyze negative association definition
Negative association means one variable increases as the other decreases, or vice versa.
Step2: Analyze positive association definition
Positive association means both variables increase/decrease together.
Step3: Match variable pairs to association type
Evaluate logical relationship between each variable pair.
Step4: Classify scatter plots by pattern
Match scatter plot shape/direction to given association types.

Snap & solve any problem in the app
Get step-by-step solutions on Sovi AI
Photo-based solutions with guided steps
Explore more problems and detailed explanations
- C. As one variable decreases, the other variable increases
- D. As one variable increases, the other variable increases
- Negative
- Positive
- None
- Negative
- Positive
- C. Non-Linear
- E. Outlier
- G. Weak
- A. Positive and Linear
- B. Negative and Linear
- F. Clustering
- F. Clustering
- B. Negative and Linear, H. Strong