QUESTION IMAGE
Question
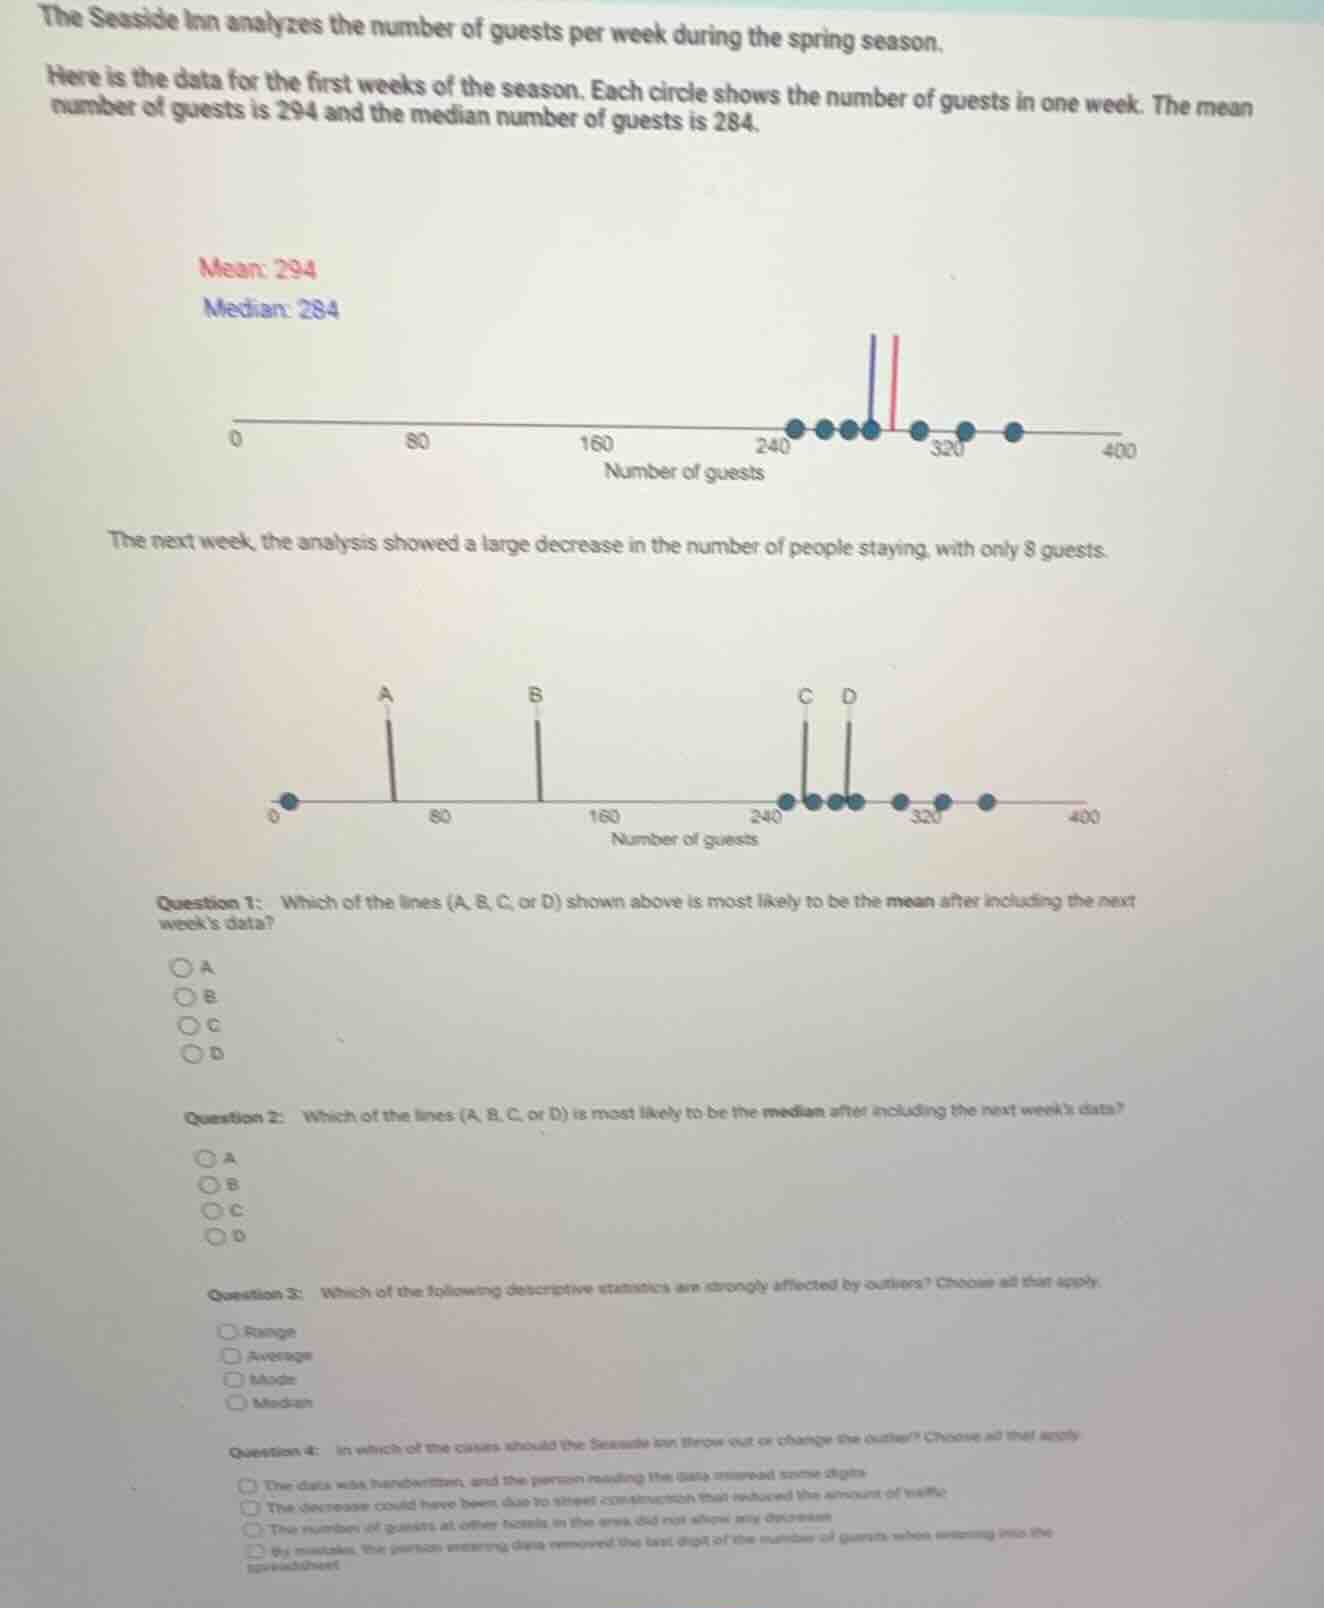
the seaside inn analyzes the number of guests per week during the spring season. here is the data for the first weeks of the season. each circle shows the number of guests in one week. the mean number of guests is 294 and the median number of guests is 284. mean: 294 median: 284 a dot plot with number of guests on the x - axis from 0 to 400, marked at 0, 80, 160, 240, 320, 400. several blue dots are plotted. there are two vertical lines, one blue and one red, near the 240 - 320 range. the next week, the analysis showed a large decrease in the number of people staying, with only 8 guests. another dot plot with number of guests on the x - axis from 0 to 400, marked at 0, 80, 160, 240, 320, 400. a blue dot at 0, and four vertical lines labeled a, b, c, d at different positions (a near 0 - 80, b near 80 - 160, c and d near 240 - 320), and several blue dots plotted. question 1: which of the lines (a, b, c, or d) shown above is most likely to be the mean after including the next week’s data? a b c d question 2: which of the lines (a, b, c, or d) is most likely to be the median after including the next week’s data? a b c d question 3: which of the following descriptive statistics are strongly affected by outliers? choose all that apply. range average mode median question 4: in which of the cases should the seaside inn throw out or change the outlier? choose all that apply. the data was handwritten, and the person reading the data misread some digits. the decrease could have been due to street construction that reduced the amount of traffic. the number of guests at other hotels in the area did not show any decrease. by mistake, the person entering data removed the last digit of the number of guests when entering into the spreadsheet.
Step1: Count original data points
Count the circles in the first plot: 7 data points.
Step2: Calculate original total guests
Use mean formula: $\text{Total} = \text{Mean} \times \text{Count} = 294 \times 7 = 2058$
Step3: Calculate new total and mean
Add 8 guests: $\text{New Total} = 2058 + 8 = 2066$
New count = 8. $\text{New Mean} = \frac{2066}{8} = 258.25$
Step4: Find original median position
Original $n=7$, median is 4th value = 284.
Step5: Find new median position
New $n=8$, median is average of 4th and 5th values. The new data set (sorted) has 8 as the first value, so 4th and 5th values are still the 3rd and 4th of original data, both ≥284. The median is between 240-320, closer to original median.
Step6: Identify outlier-affected stats
Range depends on min/max, average (mean) uses all values; both are affected by outliers. Mode/median are resistant.
Step7: Identify valid outlier removal cases
Outliers are removed if they are data entry errors, not real events.
---

Snap & solve any problem in the app
Get step-by-step solutions on Sovi AI
Photo-based solutions with guided steps
Explore more problems and detailed explanations
- C
- D
- Range, Average
- The data was handwritten, and the person reading the data misread some digits; By mistake, the person entering data removed the last digit of the number of guests when entering into the spreadsheet