QUESTION IMAGE
Question
select the correct answer.
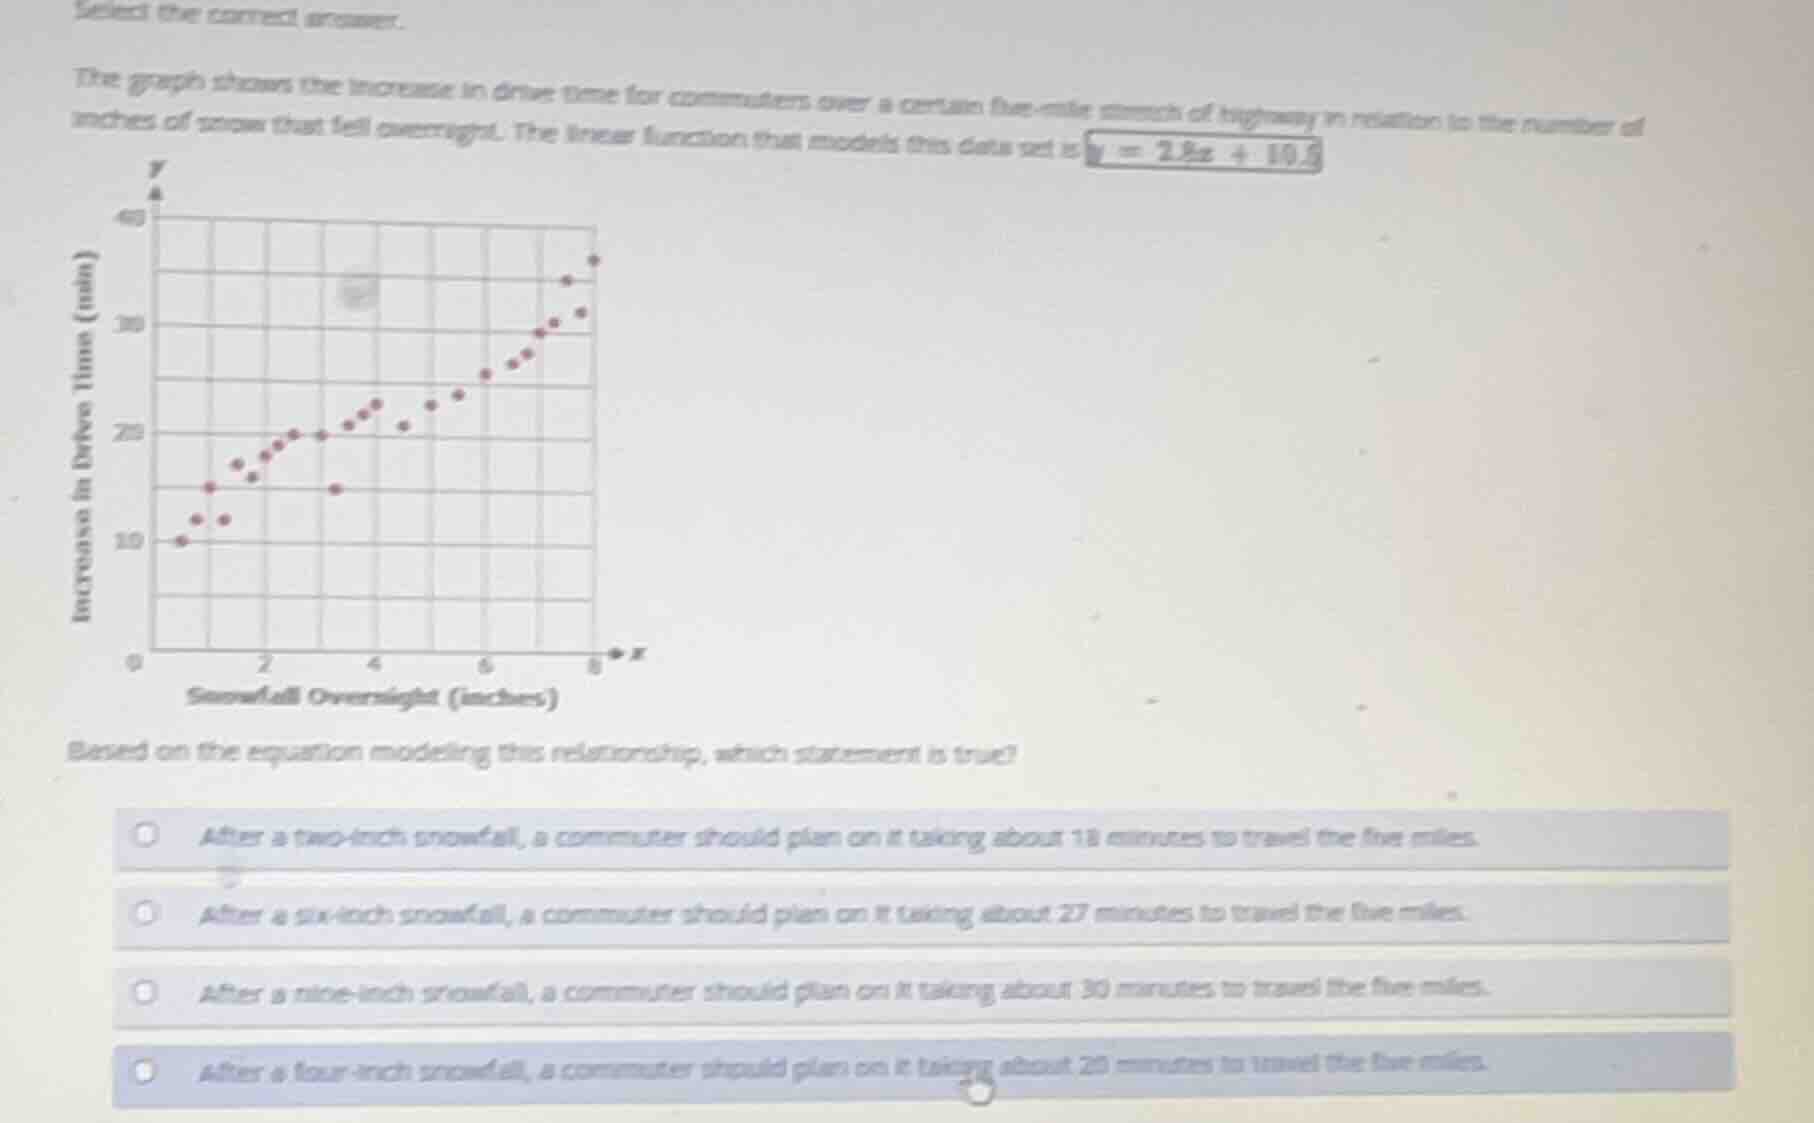
the graph shows the increase in drive time for commuters over a certain five - mile stretch of highway in relation to the number of inches of snow that fell overnight. the linear function that models this data set is ( y = 2.8x + 10.5 )
based on the equation modeling this relationship, which statement is true?
- after a two - inch snowfall, a commuter should plan on it taking about 18 minutes to travel the five miles.
- after a six - inch snowfall, a commuter should plan on it taking about 27 minutes to travel the five miles.
- after a nine - inch snowfall, a commuter should plan on it taking about 30 minutes to travel the five miles.
- after a four - inch snowfall, a commuter should plan on it taking about 20 minutes to travel the five miles.
Step1: Define variables
Let $x$ = snowfall (inches), $y$ = increase in drive time (minutes)
Model: $y = 2.8x + 10.8$
Step2: Test Option A (x=2)
Substitute $x=2$:
$y = 2.8(2) + 10.8 = 5.6 + 10.8 = 16.4$
16.4 ≠ 18, so A is false.
Step3: Test Option B (x=6)
Substitute $x=6$:
$y = 2.8(6) + 10.8 = 16.8 + 10.8 = 27.6$
27.6 ≈ 27, so B is true.
Step4: Verify remaining options (optional)
Test Option C (x=9):
$y = 2.8(9) + 10.8 = 25.2 + 10.8 = 36$
36 ≠ 30, so C is false.
Test Option D (x=4):
$y = 2.8(4) + 10.8 = 11.2 + 10.8 = 22$
22 ≠ 20, so D is false.

Snap & solve any problem in the app
Get step-by-step solutions on Sovi AI
Photo-based solutions with guided steps
Explore more problems and detailed explanations
B. After a six-inch snowfall, a commuter should plan on it taking about 27 minutes to travel the five miles.