QUESTION IMAGE
Question
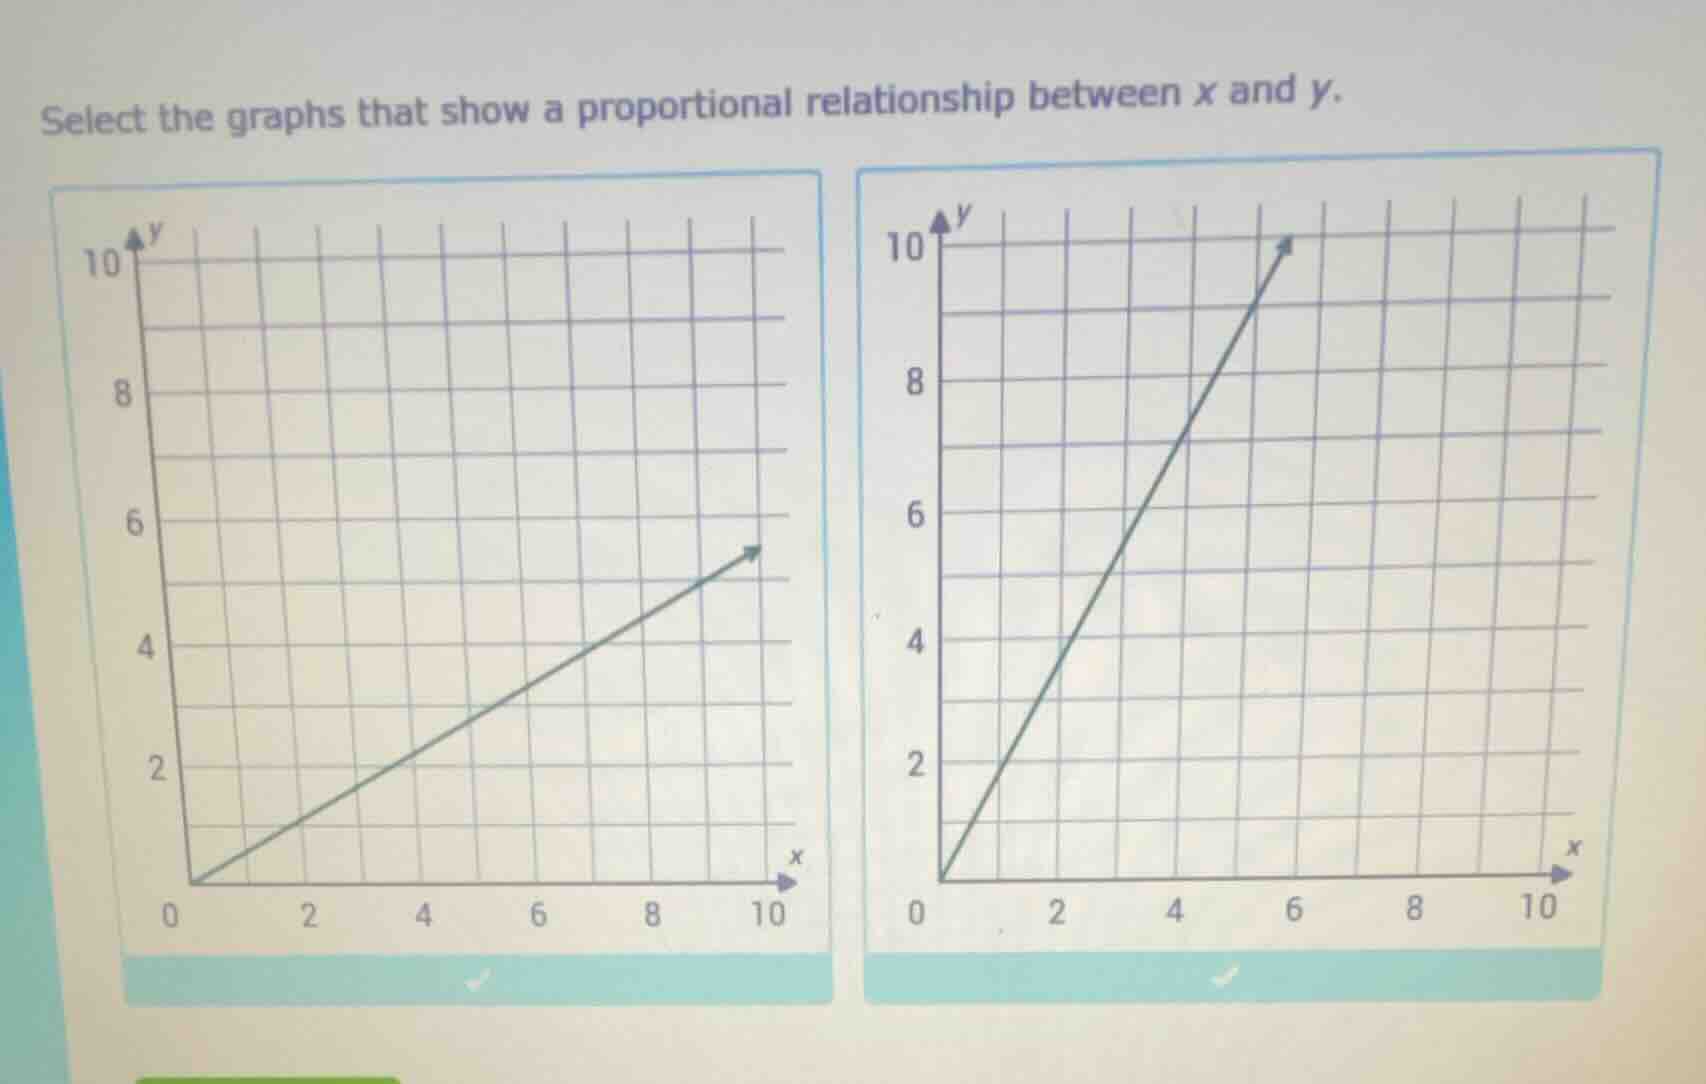
select the graphs that show a proportional relationship between x and y.
Step1: Recall Proportional Relationship
A proportional relationship between \( x \) and \( y \) is of the form \( y = kx \) (where \( k \) is a constant), and its graph is a straight line passing through the origin \((0,0)\) with a constant slope.
Step2: Analyze First Graph
The first graph has a straight line starting at \((0,0)\) and going up. Let's check the slope. For example, when \( x = 10 \), \( y = 5 \) (approx, from the grid). The slope \( k=\frac{y}{x}=\frac{5}{10} = 0.5\), constant. And it passes through the origin.
Step3: Analyze Second Graph
The second graph also has a straight line starting at \((0,0)\). When \( x = 6 \), \( y = 10 \)? Wait, no, looking at the grid, when \( x = 5 \) (approx), \( y = 8 \)? Wait, actually, the key is it's a straight line through the origin. The line passes through \((0,0)\) and has a constant slope (since it's a straight line), so it represents \( y = kx \) (proportional).
Step4: Conclusion
Both graphs are straight lines passing through the origin, so they show a proportional relationship between \( x \) and \( y \).

Snap & solve any problem in the app
Get step-by-step solutions on Sovi AI
Photo-based solutions with guided steps
Explore more problems and detailed explanations
Both the first (left) and the second (right) graphs show a proportional relationship between \( x \) and \( y \).