QUESTION IMAGE
Question
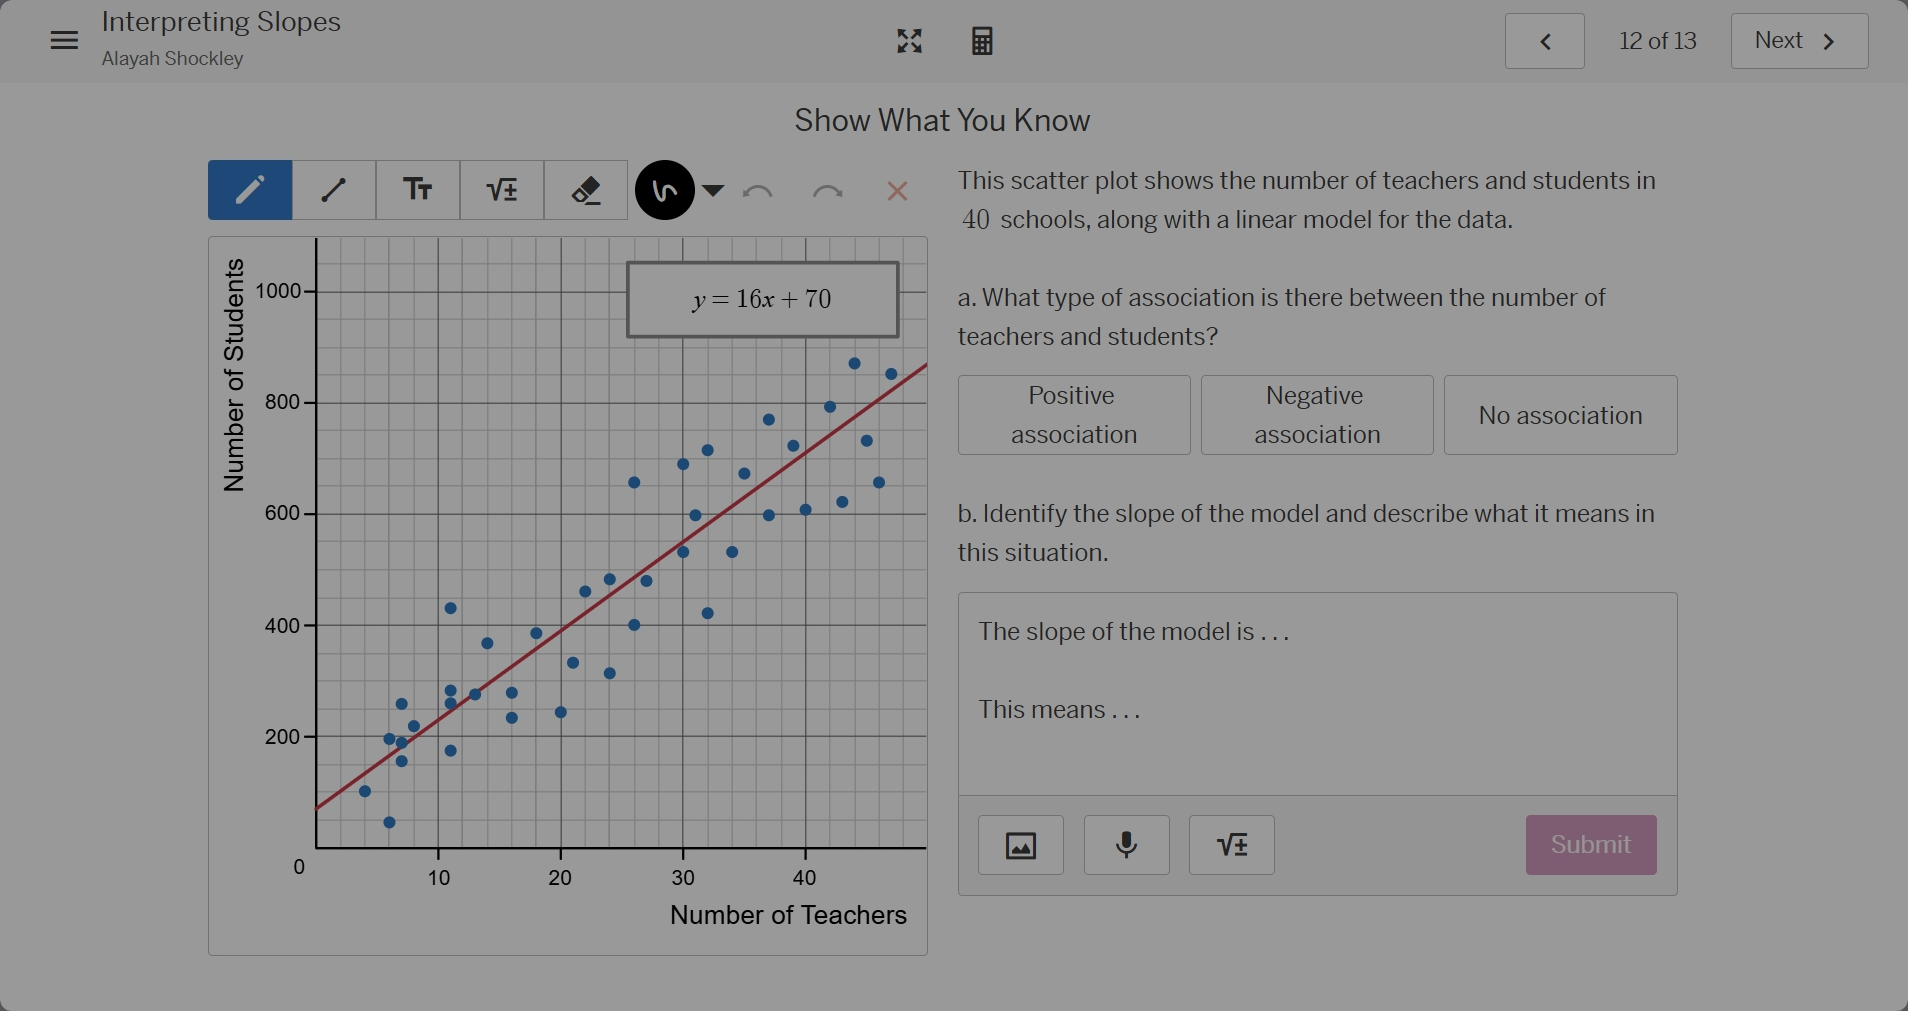
show what you know this scatter plot shows the number of teachers and students in 40 schools, along with a linear model for the data. a. what type of association is there between the number of teachers and students? positive association negative association no association b. identify the slope of the model and describe what it means in this situation. the slope of the model is … this means …
Part (a)
To determine the association, we analyze the scatter plot and the linear model. The linear model \( y = 16x + 70 \) has a positive slope (16), and the scatter plot points trend upward as the number of teachers (x - axis) increases. A positive association means that as one variable (number of teachers) increases, the other variable (number of students) also tends to increase.
Step1: Identify the slope from the linear equation
The linear model is given by \( y = 16x + 70 \). The general form of a linear equation is \( y = mx + b \), where \( m \) is the slope and \( b \) is the y - intercept. Comparing \( y = 16x + 70 \) with \( y = mx + b \), we can see that \( m = 16 \).
Step2: Interpret the slope
In this context, \( x \) represents the number of teachers and \( y \) represents the number of students. The slope \( m = 16 \) means that for each additional teacher in a school, the number of students is expected to increase by 16, according to the linear model.

Snap & solve any problem in the app
Get step-by-step solutions on Sovi AI
Photo-based solutions with guided steps
Explore more problems and detailed explanations
a. Positive association