QUESTION IMAGE
Question
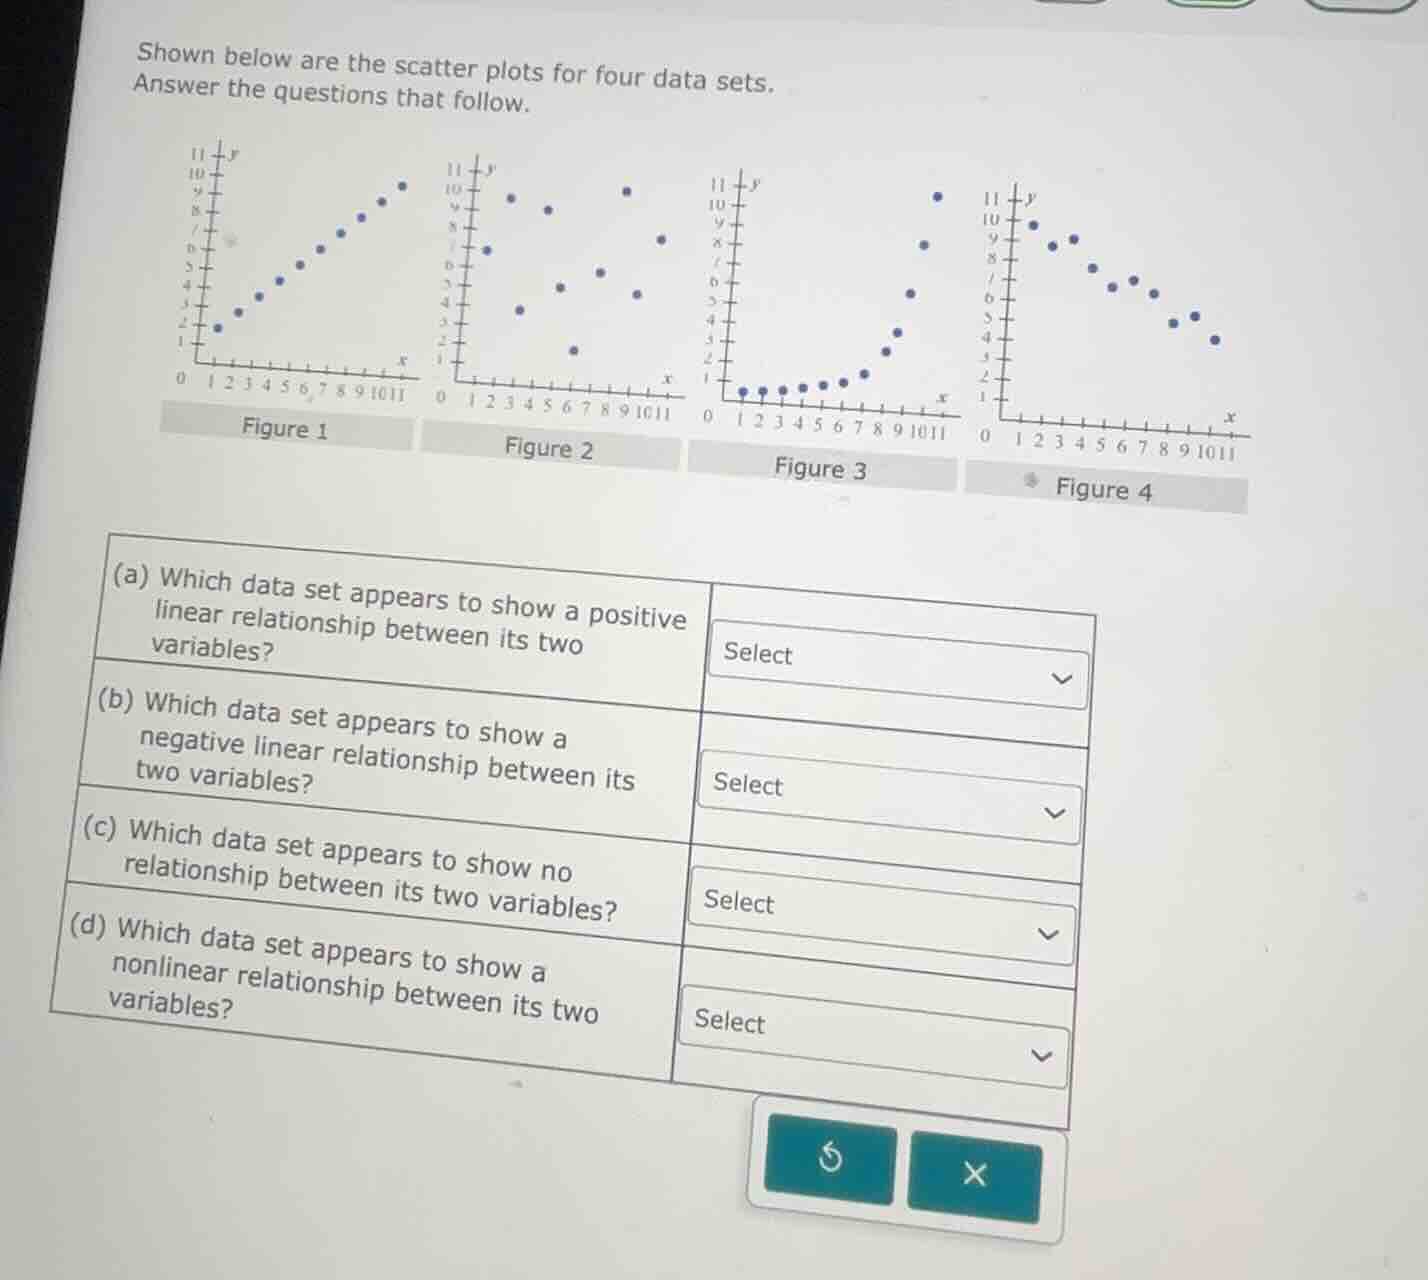
shown below are the scatter plots for four data sets.
answer the questions that follow.
(a) which data set appears to show a positive linear relationship between its two variables? select
(b) which data set appears to show a negative linear relationship between its two variables? select
(c) which data set appears to show no relationship between its two variables? select
(d) which data set appears to show a nonlinear relationship between its two variables? select
Part (a)
Step1: Recall positive linear relationship
A positive linear relationship means as \( x \) increases, \( y \) generally increases in a straight - line - like pattern.
Looking at the figures:
- Figure 1: As \( x \) increases, \( y \) increases in a relatively straight - line pattern.
- Figure 2: The points are scattered randomly, no clear positive linear trend.
- Figure 3: The relationship is nonlinear (curved upward, not a straight line).
- Figure 4: As \( x \) increases, \( y \) decreases, so it's a negative relationship.
So the data set with a positive linear relationship is Figure 1.
Step2: Conclusion for part (a)
From the analysis of the scatter plots, Figure 1 shows a positive linear relationship.
Part (b)
Step1: Recall negative linear relationship
A negative linear relationship means as \( x \) increases, \( y \) generally decreases in a straight - line - like pattern.
Looking at the figures:
- Figure 1: Positive relationship.
- Figure 2: Random scatter.
- Figure 3: Non - linear.
- Figure 4: As \( x \) increases, \( y \) decreases in a relatively straight - line pattern.
So the data set with a negative linear relationship is Figure 4.
Step2: Conclusion for part (b)
From the analysis of the scatter plots, Figure 4 shows a negative linear relationship.
Part (c)
Step1: Recall no relationship
No relationship means the points are scattered randomly with no discernible pattern (neither linear nor nonlinear trend).
Looking at the figures:
- Figure 1: Positive linear.
- Figure 2: The points are scattered all over the place, with no clear trend (neither increasing nor decreasing in a linear or nonlinear way).
- Figure 3: Non - linear (curved).
- Figure 4: Negative linear.
So the data set with no relationship is Figure 2.
Step2: Conclusion for part (c)
From the analysis of the scatter plots, Figure 2 shows no relationship between the two variables.
Part (d)

Snap & solve any problem in the app
Get step-by-step solutions on Sovi AI
Photo-based solutions with guided steps
Explore more problems and detailed explanations
s:
(a) Figure 1
(b) Figure 4
(c) Figure 2
(d) Figure 3