QUESTION IMAGE
Question
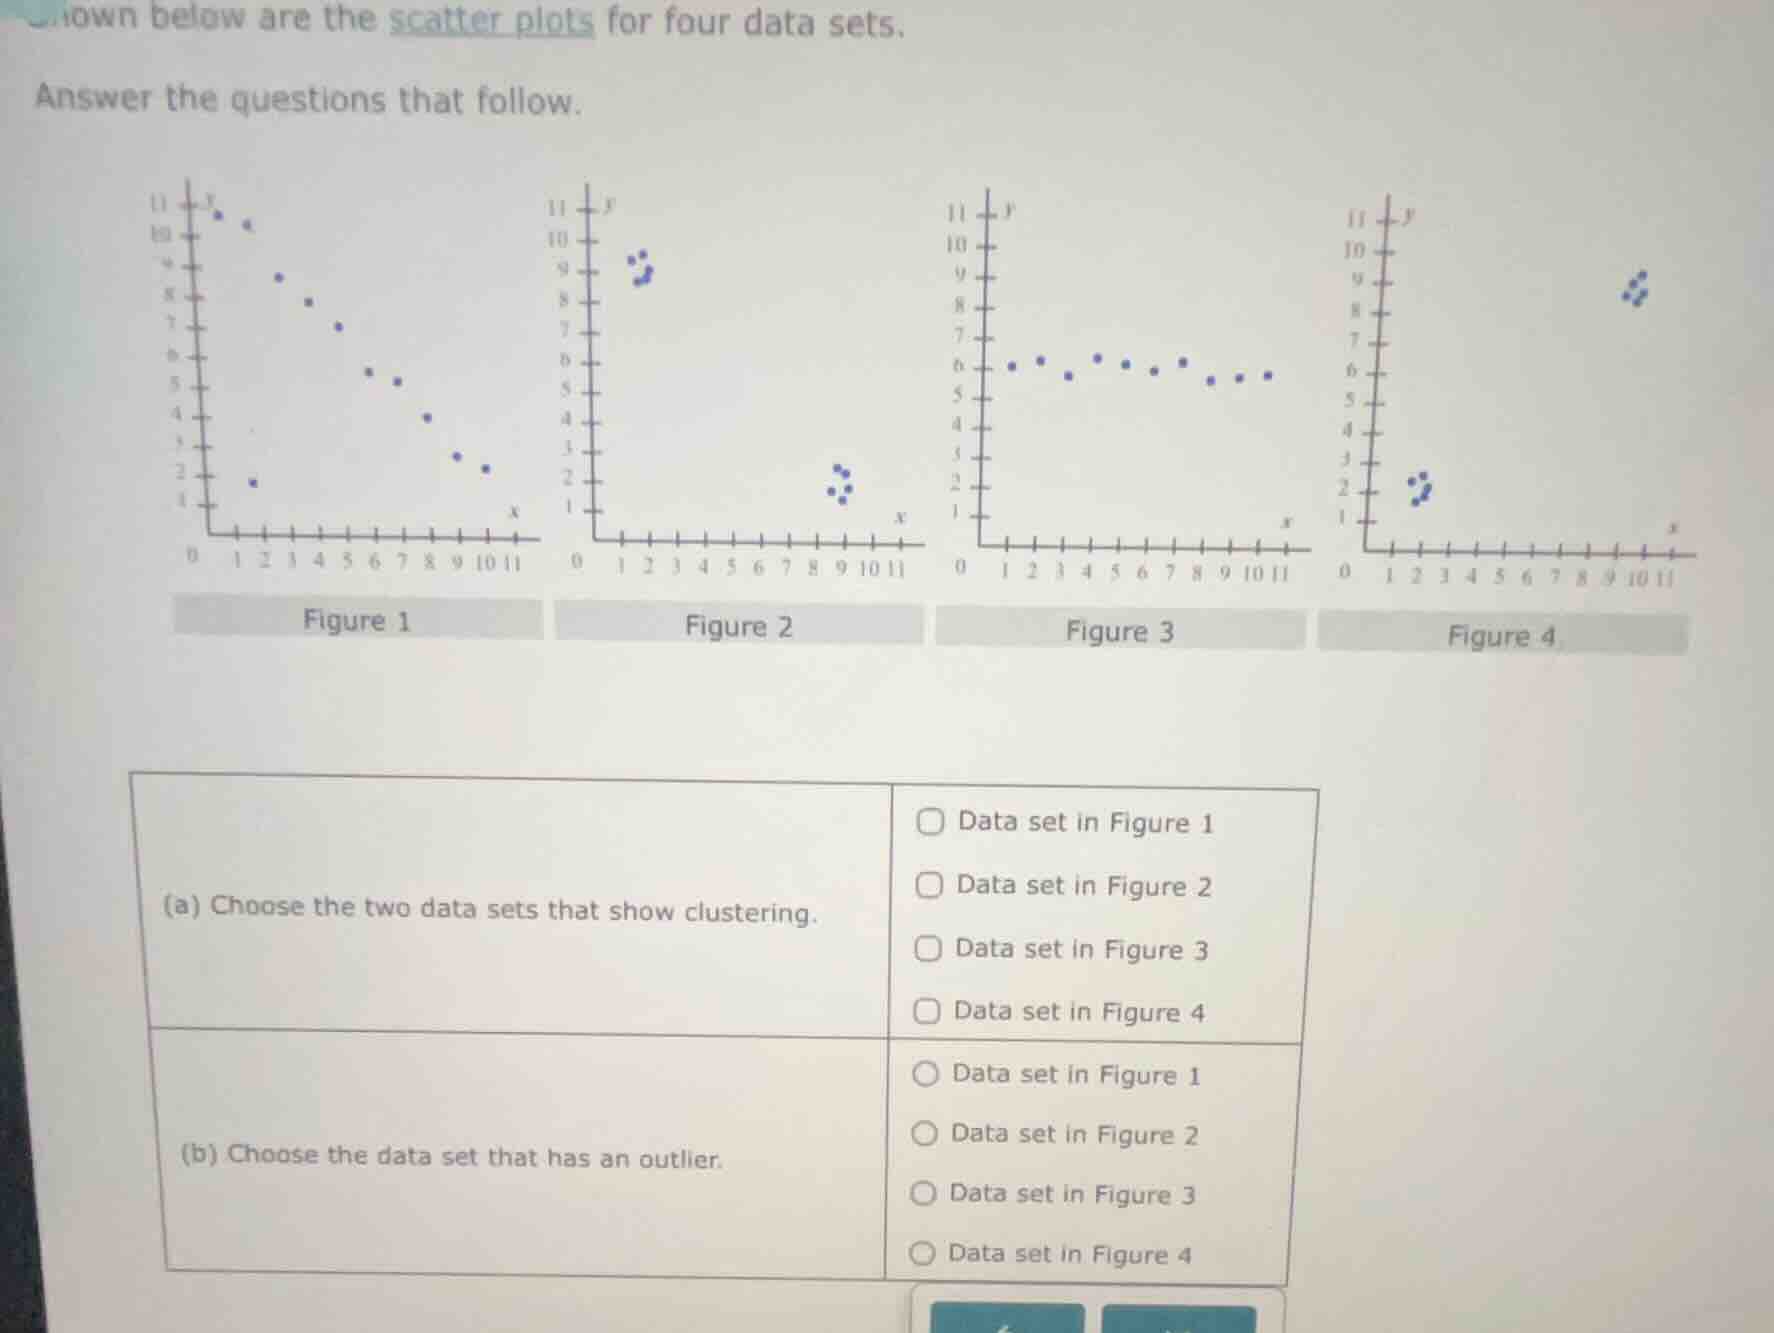
shown below are the scatter plots for four data sets.
answer the questions that follow.
(a) choose the two data sets that show clustering.
□ data set in figure 1
□ data set in figure 2
□ data set in figure 3
□ data set in figure 4
(b) choose the data set that has an outlier.
○ data set in figure 1
○ data set in figure 2
○ data set in figure 3
○ data set in figure 4
(a) Clustering means data points form distinct, separate groups. Figure 2 has two clear clusters, and Figure 4 also has two separate clusters of points.
(b) An outlier is a point far from the main group. In Figure 1, one point at (2, 2) is isolated from the main trend of other points.

Snap & solve any problem in the app
Get step-by-step solutions on Sovi AI
Photo-based solutions with guided steps
Explore more problems and detailed explanations
(a)
- Data set in Figure 2
- Data set in Figure 4
(b)
- Data set in Figure 1