QUESTION IMAGE
Question
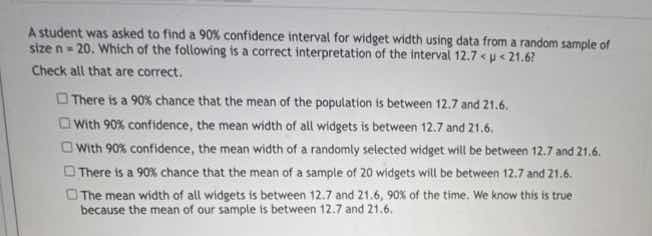
a student was asked to find a 90% confidence interval for widget width using data from a random sample of size n = 20. which of the following is a correct interpretation of the interval 12.7 < μ < 21.6?
check all that are correct.
- there is a 90% chance that the mean of the population is between 12.7 and 21.6.
- with 90% confidence, the mean width of all widgets is between 12.7 and 21.6.
- with 90% confidence, the mean width of a randomly selected widget will be between 12.7 and 21.6.
- there is a 90% chance that the mean of a sample of 20 widgets will be between 12.7 and 21.6.
- the mean width of all widgets is between 12.7 and 21.6, 90% of the time. we know this is true because the mean of our sample is between 12.7 and 21.6.
Brief Explanations
- A confidence interval does not mean there is a 90% chance the population mean is in the interval (the population mean is a fixed value, not random).
- The correct interpretation is that we are 90% confident the true population mean (mean width of all widgets) lies within the interval.
- Confidence intervals apply to the population mean, not individual widgets or sample means.
- The population mean is not "between 12.7 and 21.6 90% of the time"—it is a fixed value, and our method of creating intervals captures it 90% of the time.

Snap & solve any problem in the app
Get step-by-step solutions on Sovi AI
Photo-based solutions with guided steps
Explore more problems and detailed explanations
With 90% confidence, the mean width of all widgets is between 12.7 and 21.6.