QUESTION IMAGE
Question
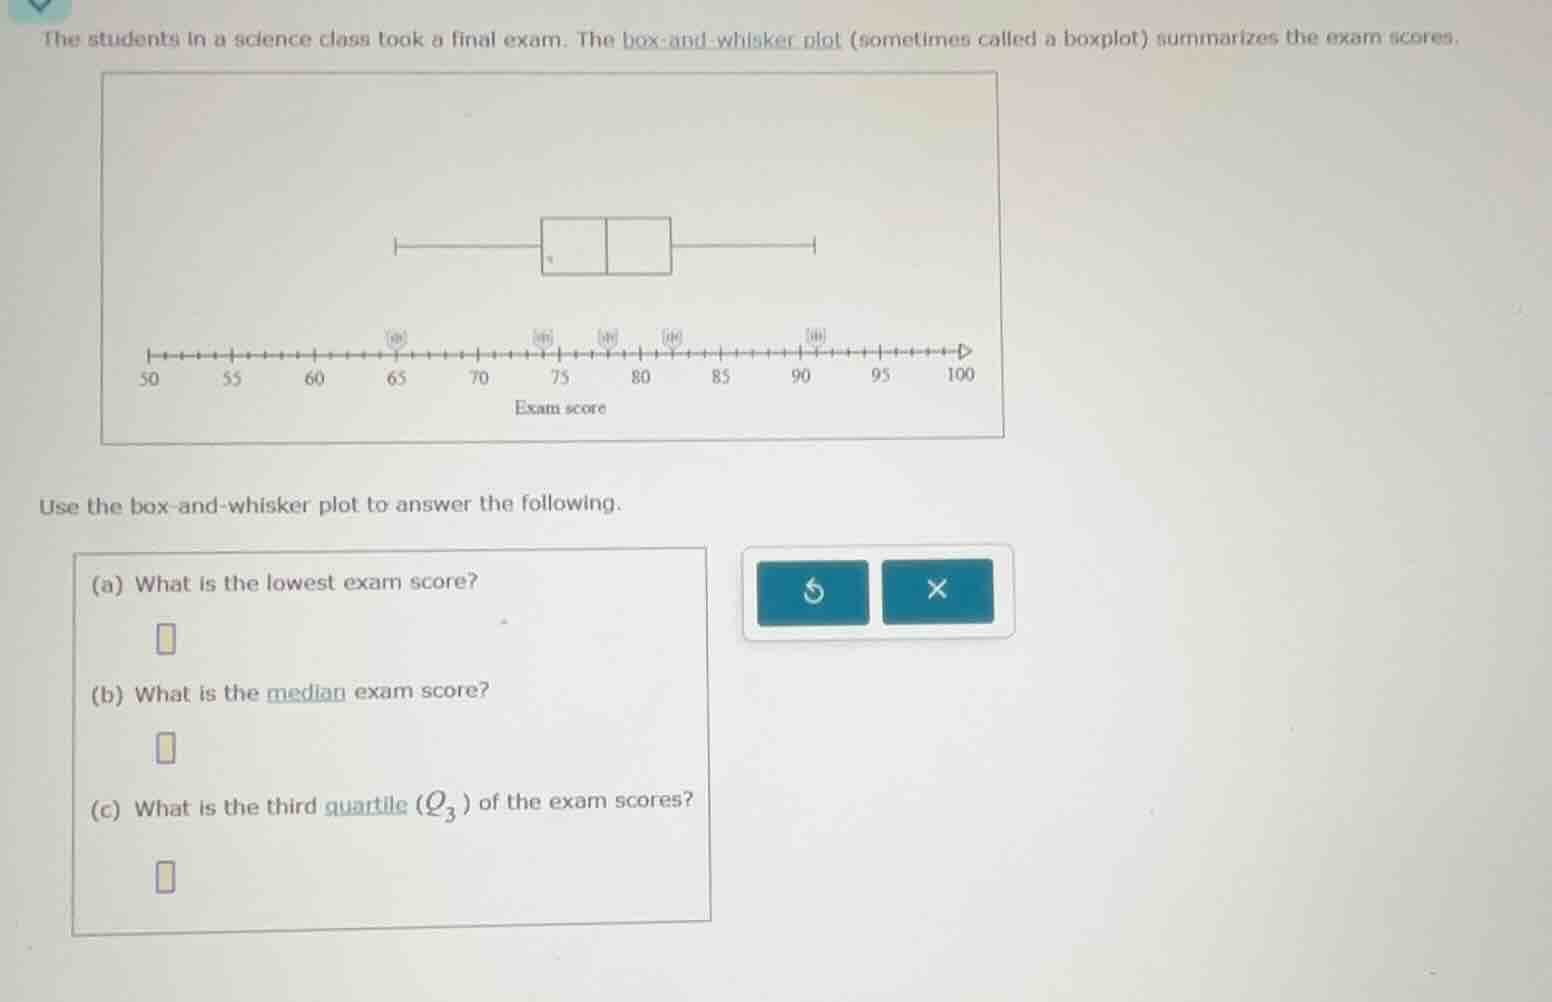
the students in a science class took a final exam. the box - and - whisker plot (sometimes called a boxplot) summarizes the exam scores. use the box - and - whisker plot to answer the following. (a) what is the lowest exam score? (b) what is the median exam score? (c) what is the third quartile ($q_3$) of the exam scores?
Part (a)
Step1: Identify lowest score from boxplot
The left whisker's end shows the minimum (lowest) score. From the plot, the leftmost point is at 60? Wait, no, looking at the axis: the left whisker starts at 60? Wait, no, the axis has marks: 50, 55, 60, 65, 70, 75, 80, 85, 90, 95, 100. Wait, the left whisker is at 60? Wait, no, the first vertical line (left whisker end) is at 60? Wait, no, let's check the boxplot. The left whisker extends to the minimum value. Wait, maybe I misread. Wait, the axis: 50, then 55, 60, 65, 70, 75, 80, 85, 90, 95, 100. The left whisker's end is at 60? Wait, no, maybe the leftmost point is 60? Wait, no, let's see: the boxplot's left whisker is from the minimum to Q1. Wait, maybe the minimum is 60? Wait, no, maybe I made a mistake. Wait, the plot: the left whisker starts at 60? Wait, the x-axis: 50, then each tick is 1? Wait, 50, then 51,52,...60,61,...65, etc. Wait, the left whisker's end is at 60? Wait, no, the first vertical line (left whisker) is at 60? Wait, maybe the minimum score is 60? Wait, no, maybe 60? Wait, let's re-examine. The boxplot: the left whisker is the line from the minimum to Q1. So the leftmost point (minimum) is at 60? Wait, maybe. Alternatively, maybe the left whisker is at 60. So the lowest exam score is 60? Wait, no, maybe 60? Wait, let's check the axis again. The x-axis starts at 50, with ticks every 1? Wait, 50, then 55, 60, 65, 70, 75, 80, 85, 90, 95, 100. So between 50 and 55, there are 5 ticks (51-55), then 56-60 (5 ticks), so 60 is a major tick. So the left whisker's end is at 60? So the lowest score is 60.
Step2: Confirm
Wait, maybe the minimum is 60. So the lowest exam score is 60.
Step1: Find median in boxplot
The median is the line inside the box (or the middle of the box if split). Wait, the box is split into two parts. The median is the middle line of the box. Looking at the boxplot, the median (middle line) is at 75? Wait, no, the box is between Q1 and Q3, with the median inside. Wait, the box is split into two, so the median is at 75? Wait, no, the box is from Q1 to Q3, and the median is the line inside. Wait, the box is at 75 to 80? Wait, no, the box has two parts: left part (Q1 to median) and right part (median to Q3). Wait, the box is between 75 and 80? Wait, the x-axis: 75, 80. So the median is at 75? Wait, no, the box is split into two, so the median is at 75? Wait, maybe the median is 75. Wait, let's see: the boxplot's median is the vertical line inside the box. So if the box is from 75 to 80, and split, the median is at 75? No, maybe 75. Wait, maybe the median is 75. So the median exam score is 75? Wait, no, maybe 75.
Step2: Confirm
The median is the middle value of the dataset, represented by the line inside the box in a boxplot. So if the box is split, the median is at 75. So the median exam score is 75.
Step1: Find Q3 in boxplot
The third quartile (Q3) is the right end of the box. The box extends from Q1 to Q3. So the right end of the box is at 80? Wait, the box is from Q1 (75) to Q3 (80)? Wait, the box's right end is at 80? So Q3 is 80.
Step2: Confirm
In a boxplot, the box's right end is Q3 (third quartile). So the right end of the box is at 80, so Q3 is 80.

Snap & solve any problem in the app
Get step-by-step solutions on Sovi AI
Photo-based solutions with guided steps
Explore more problems and detailed explanations
60