QUESTION IMAGE
Question
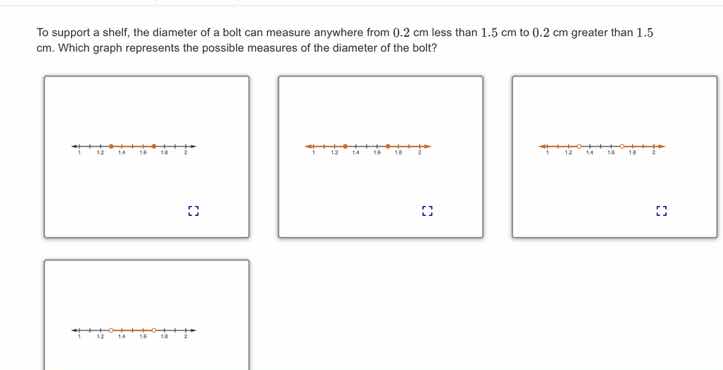
to support a shelf, the diameter of a bolt can measure anywhere from 0.2 cm less than 1.5 cm to 0.2 cm greater than 1.5 cm. which graph represents the possible measures of the diameter of the bolt?
Step1: Determine the range of the bolt's diameter
The diameter can be from \(1.5 - 0.2\) cm to \(1.5+ 0.2\) cm. Calculate the lower and upper bounds:
Lower bound: \(1.5 - 0.2=1.3\) cm.
Upper bound: \(1.5 + 0.2 = 1.7\) cm.
So the diameter \(d\) satisfies \(1.3\leq d\leq1.7\).
Step2: Analyze the number line representation
A closed circle on a number line represents that the point is included in the solution set. Since the diameter can be equal to \(1.3\) and \(1.7\) (as it's "from \(0.2\) cm less than \(1.5\) cm to \(0.2\) cm greater than \(1.5\) cm", including the endpoints), we need a number line with closed circles at \(1.3\) and \(1.7\) and the line segment between them shaded.

Snap & solve any problem in the app
Get step-by-step solutions on Sovi AI
Photo-based solutions with guided steps
Explore more problems and detailed explanations
The graph with closed circles at \(1.3\) and \(1.7\) (or the corresponding positions on the number line) and the region between them shaded (the fourth graph in the given set, assuming the fourth has closed circles at \(1.3\) and \(1.7\) and the segment in between shaded).