QUESTION IMAGE
Question
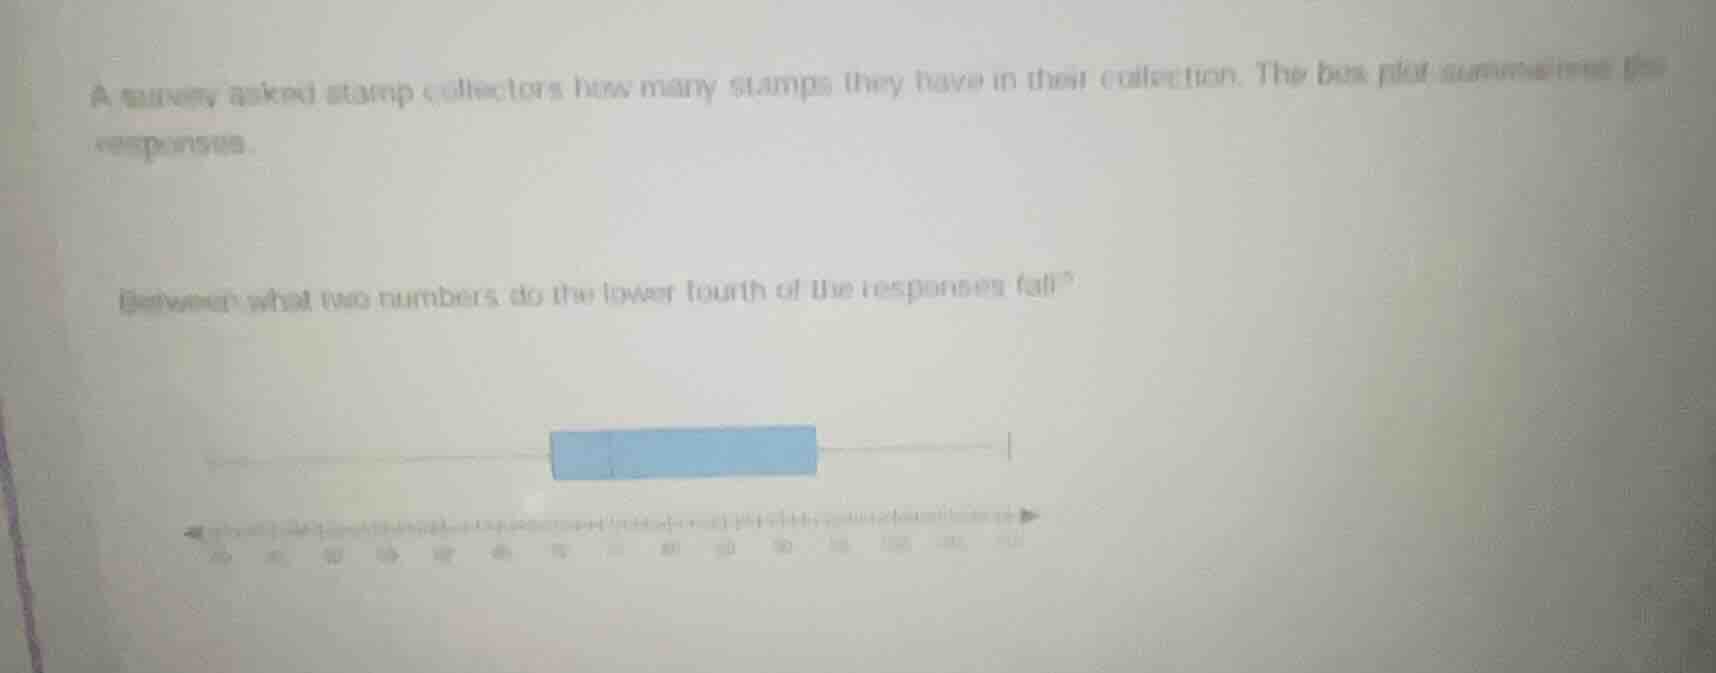
a survey asked stamp collectors how many stamps they have in their collection. the box plot summarizes the responses.
between what two numbers do the lower fourth of the responses fall?
To determine the range for the lower fourth (first quartile range) of the responses from the box - plot:
Step 1: Recall the components of a box - plot
A box - plot consists of the minimum value, the first quartile (\(Q_1\)), the median (\(Q_2\)), the third quartile (\(Q_3\)) and the maximum value. The lower fourth (the data in the first quartile) lies between the minimum value and the first quartile (\(Q_1\)).
Step 2: Analyze the box - plot (from the given image description)
From the box - plot, we can see that the minimum value (the left - most point of the whisker) is 40 and the first quartile (the left - hand side of the box) is 60.

Snap & solve any problem in the app
Get step-by-step solutions on Sovi AI
Photo-based solutions with guided steps
Explore more problems and detailed explanations
The lower fourth of the responses fall between 40 and 60.