QUESTION IMAGE
Question
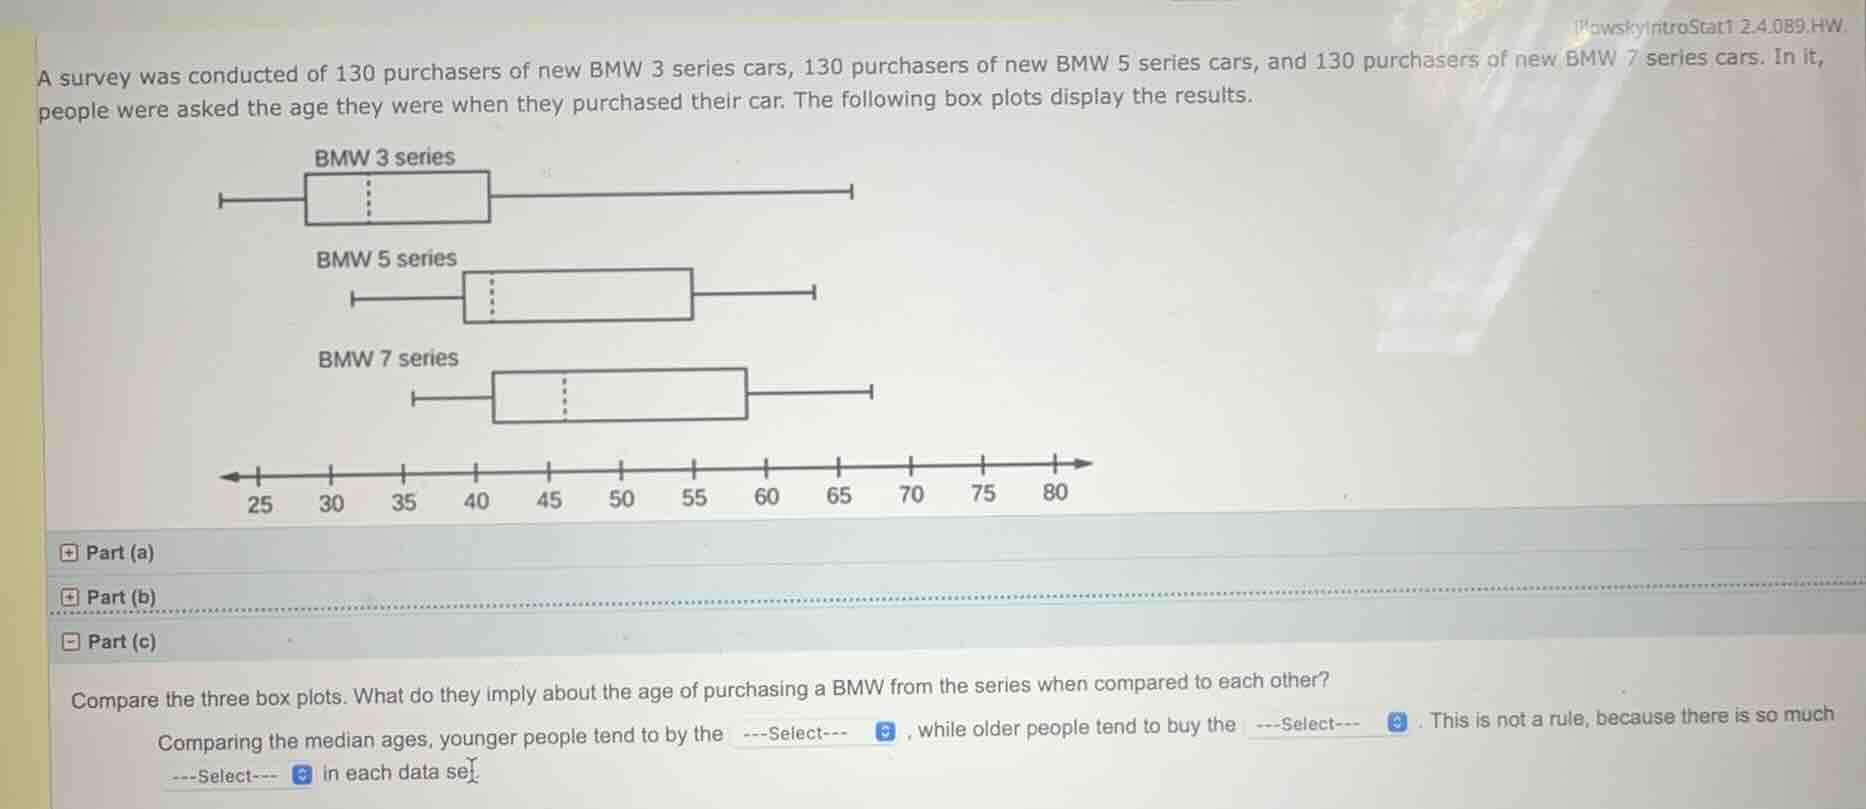
a survey was conducted of 130 purchasers of new bmw 3 series cars, 130 purchasers of new bmw 5 series cars, and 130 purchasers of new bmw 7 series cars. in it, people were asked the age they were when they purchased their car. the following box plots display the results. bmw 3 series bmw 5 series bmw 7 series 25 30 35 40 45 50 55 60 65 70 75 80 part (a) part (b) part (c) compare the three box plots. what do they imply about the age of purchasing a bmw from the series when compared to each other? comparing the median ages, younger people tend to by the ---select---, while older people tend to buy the ---select---. this is not a rule, because there is so much ---select--- in each data set.
- For the first blank: The median (dashed line in box plot) of BMW 3 series is the left - most among the three, meaning younger people (lower median age) tend to buy BMW 3 series.
- For the second blank: The median of BMW 7 series is the right - most among the three, meaning older people (higher median age) tend to buy BMW 7 series.
- For the third blank: The box plots have long whiskers and spread out data, indicating a lot of variability (overlap or spread) in each data set, so the term is "overlap" or "variability" (in context, "overlap" as data sets have overlapping ranges).

Snap & solve any problem in the app
Get step-by-step solutions on Sovi AI
Photo-based solutions with guided steps
Explore more problems and detailed explanations
- First Select: BMW 3 series
- Second Select: BMW 7 series
- Third Select: overlap (or variability)