QUESTION IMAGE
Question
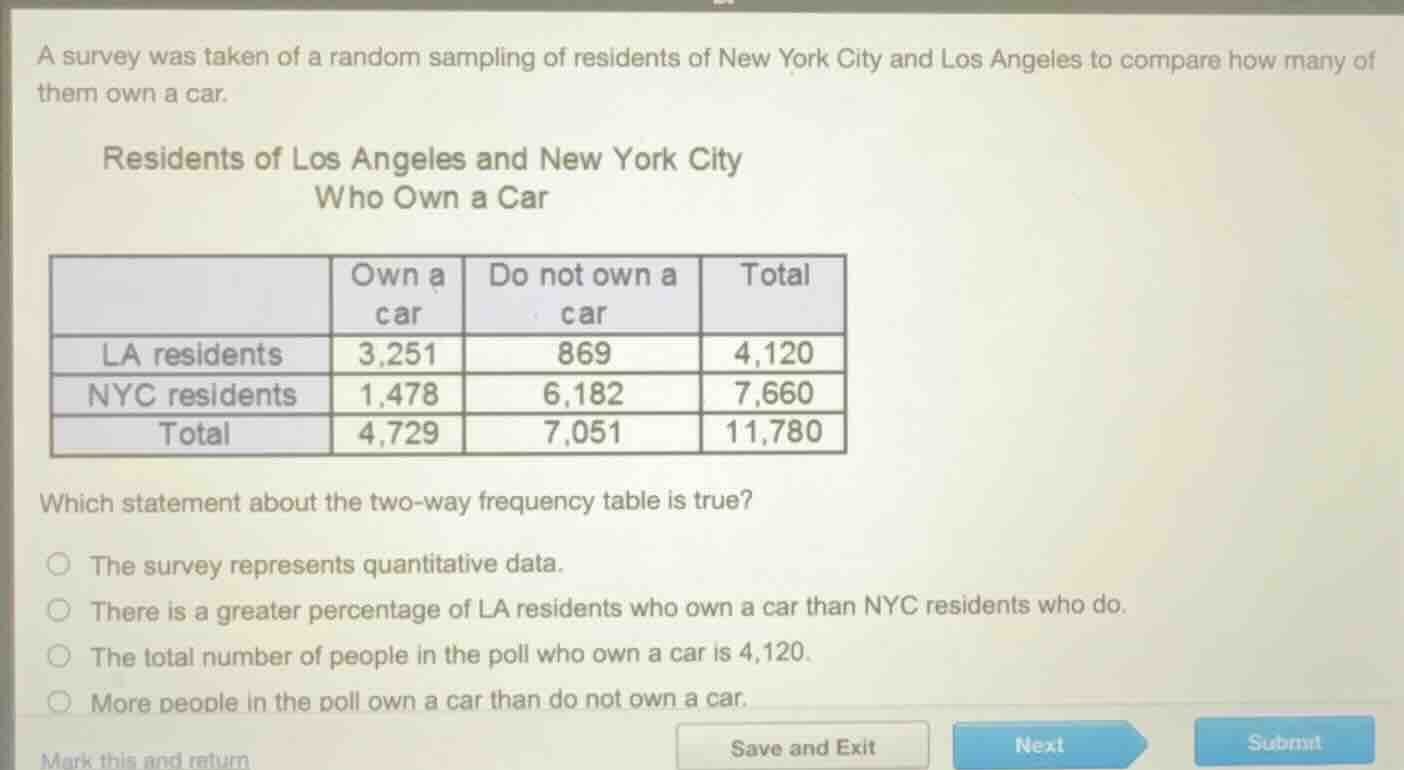
a survey was taken of a random sampling of residents of new york city and los angeles to compare how many of them own a car.
residents of los angeles and new york city
who own a car
| own a car | do not own a car | total | |
|---|---|---|---|
| nyc residents | 1,478 | 6,182 | 7,660 |
| total | 4,729 | 7,051 | 11,780 |
which statement about the two - way frequency table is true?
- the survey represents quantitative data.
- there is a greater percentage of la residents who own a car than nyc residents who do.
- the total number of people in the poll who own a car is 4,120.
- more people in the poll own a car than do not own a car.
Step1: Analyze first option
The survey categorizes residents by city and car ownership (categorical groups), not numerical measurements, so it is qualitative data, not quantitative. This statement is false.
Step2: Calculate LA car ownership %
Find percentage of LA residents with a car:
$\frac{3,251}{4,120} \times 100\% \approx 78.9\%$
Step3: Calculate NYC car ownership %
Find percentage of NYC residents with a car:
$\frac{1,478}{7,660} \times 100\% \approx 19.3\%$
Compare the two percentages: $78.9\% > 19.3\%$, so this statement is true.
Step4: Verify third option
The total number of people who own a car is 4,729 (from the "Total" row, "Own a car" column), not 4,120. This statement is false.
Step5: Compare car ownership totals
Total who own a car: 4,729; total who do not own a car: 7,051. $4,729 < 7,051$, so this statement is false.

Snap & solve any problem in the app
Get step-by-step solutions on Sovi AI
Photo-based solutions with guided steps
Explore more problems and detailed explanations
There is a greater percentage of LA residents who own a car than NYC residents who do.