QUESTION IMAGE
Question
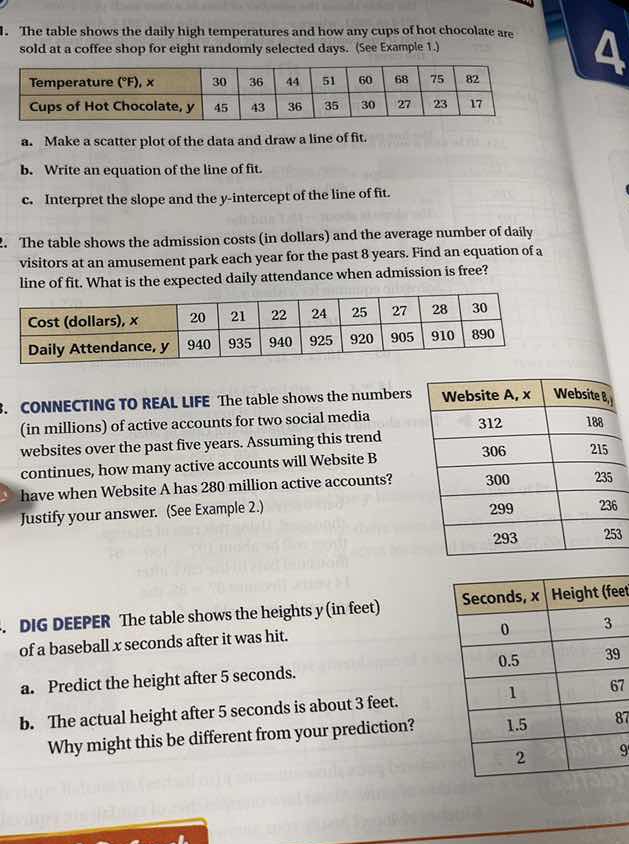
- the table shows the daily high temperatures and how any cups of hot chocolate are sold at a coffee shop for eight randomly selected days. (see example 1.)
| temperature (°f), ( x ) | 30 | 36 | 44 | 51 | 60 | 68 | 75 | 82 |
| cups of hot chocolate, ( y ) | 45 | 43 | 36 | 35 | 30 | 27 | 23 | 17 |
a. make a scatter plot of the data and draw a line of fit.
b. write an equation of the line of fit.
c. interpret the slope and the ( y )-intercept of the line of fit.
- the table shows the admission costs (in dollars) and the average number of daily visitors at an amusement park each year for the past 8 years. find an equation of a line of fit. what is the expected daily attendance when admission is free?
| cost (dollars), ( x ) | 20 | 21 | 22 | 24 | 25 | 27 | 28 | 30 |
| daily attendance, ( y ) | 940 | 935 | 940 | 925 | 920 | 905 | 910 | 890 |
- connecting to real life the table shows the numbers (in millions) of active accounts for two social media websites over the past five years. assuming this trend continues, how many active accounts will website b have when website a has 280 million active accounts? justify your answer. (see example 2.)
| website a, ( x ) | website b, ( y ) |
| 312 | 188 |
| 306 | 215 |
| 300 | 235 |
| 299 | 236 |
| 293 | 253 |
- dig deeper the table shows the heights ( y ) (in feet) of a baseball ( x ) seconds after it was hit.
| seconds, ( x ) | height (feet), ( y ) |
| 0 | 3 |
| 0.5 | 39 |
| 1 | 67 |
| 1.5 | 87 |
| 2 | 9 |
a. predict the height after 5 seconds.
b. the actual height after 5 seconds is about 3 feet. why might this be different from your prediction?
Problem 1 (a - c)
Part a: Scatter Plot and Line of Fit
To make a scatter plot, we plot the points \((x, y)\) where \(x\) is the temperature (°F) and \(y\) is the number of cups of hot chocolate sold. The \(x\)-axis will represent temperature, and the \(y\)-axis will represent cups of hot chocolate. After plotting the points \((30, 45)\), \((36, 43)\), \((44, 36)\), \((51, 35)\), \((60, 30)\), \((68, 27)\), \((75, 23)\), \((82, 17)\), we draw a line that best fits the trend of the points (usually a line that is as close as possible to most of the points, showing the negative linear relationship between temperature and hot chocolate sales).
Part b: Equation of the Line of Fit
First, we can find the slope \(m\) using two points. Let's take \((30, 45)\) and \((82, 17)\). The slope formula is \(m=\frac{y_2 - y_1}{x_2 - x_1}\).
- Step 1: Calculate the slope
\(m=\frac{17 - 45}{82 - 30}=\frac{-28}{52}\approx - 0.54\)
Then we use the point - slope form \(y - y_1=m(x - x_1)\). Using the point \((30, 45)\):
- Step 2: Substitute into point - slope form
\(y - 45=-0.54(x - 30)\)
\(y-45=-0.54x + 16.2\)
\(y=-0.54x+61.2\) (This is an approximate equation of the line of fit. The equation may vary slightly depending on the points chosen for calculating the slope.)
Part c: Interpreting Slope and y - intercept
- Slope: The slope \(m\approx - 0.54\) means that for every 1 - degree increase in temperature (in °F), the number of cups of hot chocolate sold decreases by approximately 0.54 cups.
- y - intercept: The y - intercept \(b = 61.2\) (when \(x = 0\), i.e., when the temperature is \(0^{\circ}\text{F}\)) represents the estimated number of cups of hot chocolate sold when the temperature is \(0^{\circ}\text{F}\). In a real - world context, a temperature of \(0^{\circ}\text{F}\) is an extreme value, but it gives the starting value of the linear model.
Problem 2: Equation of Line of Fit and Expected Attendance when Admission is Free
First, we find the slope of the line using two points. Let's take \((20, 940)\) and \((30, 890)\).
- Step 1: Calculate the slope \(m\)
\(m=\frac{890 - 940}{30 - 20}=\frac{-50}{10}=- 5\)
Using the point - slope form \(y - y_1=m(x - x_1)\) with the point \((20, 940)\):
- Step 2: Substitute into point - slope form
\(y - 940=-5(x - 20)\)
\(y-940=-5x + 100\)
\(y=-5x + 1040\)
When admission is free, \(x = 0\). Substitute \(x = 0\) into the equation:
- Step 3: Find \(y\) when \(x = 0\)
\(y=-5(0)+1040 = 1040\)
So the expected daily attendance when admission is free is 1040 visitors.
Problem 3: Active Accounts for Website B
First, we need to find the linear relationship between the number of active accounts of Website A (\(x\)) and Website B (\(y\)). Let's find the slope using two points. Let's take \((312, 188)\) and \((293, 253)\).
- Step 1: Calculate the slope \(m\)
\(m=\frac{253 - 188}{293 - 312}=\frac{65}{-19}\approx - 3.42\)
Using the point - slope form with the point \((312, 188)\):
\(y - 188=-3.42(x - 312)\)
\(y-188=-3.42x+1067.04\)
\(y=-3.42x + 1255.04\)
Now, when \(x = 280\) (Website A has 280 million active accounts):
- Step 2: Substitute \(x = 280\) into the equation
\(y=-3.42\times280 + 1255.04\)
\(y=-957.6+1255.04\)
\(y = 297.44\approx297\) (in millions)
Justification: We assumed a linear relationship between the number of active accounts of Website A and Website B. By finding the linear equation that fits the given data points, we can use it to predict the number of active accounts of Website B when we know the number of active accounts of Website A. The negative slope indicates an inverse re…

Snap & solve any problem in the app
Get step-by-step solutions on Sovi AI
Photo-based solutions with guided steps
Explore more problems and detailed explanations
Problem 1 (a - c)
Part a: Scatter Plot and Line of Fit
To make a scatter plot, we plot the points \((x, y)\) where \(x\) is the temperature (°F) and \(y\) is the number of cups of hot chocolate sold. The \(x\)-axis will represent temperature, and the \(y\)-axis will represent cups of hot chocolate. After plotting the points \((30, 45)\), \((36, 43)\), \((44, 36)\), \((51, 35)\), \((60, 30)\), \((68, 27)\), \((75, 23)\), \((82, 17)\), we draw a line that best fits the trend of the points (usually a line that is as close as possible to most of the points, showing the negative linear relationship between temperature and hot chocolate sales).
Part b: Equation of the Line of Fit
First, we can find the slope \(m\) using two points. Let's take \((30, 45)\) and \((82, 17)\). The slope formula is \(m=\frac{y_2 - y_1}{x_2 - x_1}\).
- Step 1: Calculate the slope
\(m=\frac{17 - 45}{82 - 30}=\frac{-28}{52}\approx - 0.54\)
Then we use the point - slope form \(y - y_1=m(x - x_1)\). Using the point \((30, 45)\):
- Step 2: Substitute into point - slope form
\(y - 45=-0.54(x - 30)\)
\(y-45=-0.54x + 16.2\)
\(y=-0.54x+61.2\) (This is an approximate equation of the line of fit. The equation may vary slightly depending on the points chosen for calculating the slope.)
Part c: Interpreting Slope and y - intercept
- Slope: The slope \(m\approx - 0.54\) means that for every 1 - degree increase in temperature (in °F), the number of cups of hot chocolate sold decreases by approximately 0.54 cups.
- y - intercept: The y - intercept \(b = 61.2\) (when \(x = 0\), i.e., when the temperature is \(0^{\circ}\text{F}\)) represents the estimated number of cups of hot chocolate sold when the temperature is \(0^{\circ}\text{F}\). In a real - world context, a temperature of \(0^{\circ}\text{F}\) is an extreme value, but it gives the starting value of the linear model.
Problem 2: Equation of Line of Fit and Expected Attendance when Admission is Free
First, we find the slope of the line using two points. Let's take \((20, 940)\) and \((30, 890)\).
- Step 1: Calculate the slope \(m\)
\(m=\frac{890 - 940}{30 - 20}=\frac{-50}{10}=- 5\)
Using the point - slope form \(y - y_1=m(x - x_1)\) with the point \((20, 940)\):
- Step 2: Substitute into point - slope form
\(y - 940=-5(x - 20)\)
\(y-940=-5x + 100\)
\(y=-5x + 1040\)
When admission is free, \(x = 0\). Substitute \(x = 0\) into the equation:
- Step 3: Find \(y\) when \(x = 0\)
\(y=-5(0)+1040 = 1040\)
So the expected daily attendance when admission is free is 1040 visitors.
Problem 3: Active Accounts for Website B
First, we need to find the linear relationship between the number of active accounts of Website A (\(x\)) and Website B (\(y\)). Let's find the slope using two points. Let's take \((312, 188)\) and \((293, 253)\).
- Step 1: Calculate the slope \(m\)
\(m=\frac{253 - 188}{293 - 312}=\frac{65}{-19}\approx - 3.42\)
Using the point - slope form with the point \((312, 188)\):
\(y - 188=-3.42(x - 312)\)
\(y-188=-3.42x+1067.04\)
\(y=-3.42x + 1255.04\)
Now, when \(x = 280\) (Website A has 280 million active accounts):
- Step 2: Substitute \(x = 280\) into the equation
\(y=-3.42\times280 + 1255.04\)
\(y=-957.6+1255.04\)
\(y = 297.44\approx297\) (in millions)
Justification: We assumed a linear relationship between the number of active accounts of Website A and Website B. By finding the linear equation that fits the given data points, we can use it to predict the number of active accounts of Website B when we know the number of active accounts of Website A. The negative slope indicates an inverse relationship between the number of active accounts of the two websites (as one increases, the other tends to decrease), which is supported by the given data.
Problem 4
Part a: Predict the height after 5 seconds
First, we need to find the equation of the line (or curve, but from the given data, it seems to be a quadratic relationship, but let's check the differences. Let's assume a quadratic model \(y = ax^{2}+bx + c\). We know that when \(x = 0\), \(y = 3\), so \(c = 3\). When \(x = 0.5\), \(y = 39\), so \(39=a(0.5)^{2}+b(0.5)+3\), \(39 = 0.25a+0.5b + 3\), \(0.25a+0.5b=36\) (Equation 1). When \(x = 1\), \(y = 67\), so \(67=a(1)^{2}+b(1)+3\), \(a + b=64\) (Equation 2). Multiply Equation 2 by 0.5: \(0.5a+0.5b = 32\) (Equation 3). Subtract Equation 1 from Equation 3: \((0.5a + 0.5b)-(0.25a+0.5b)=32 - 36\), \(0.25a=-4\), \(a=-16\). Substitute \(a=-16\) into Equation 2: \(-16 + b=64\), \(b = 80\). So the equation is \(y=-16x^{2}+80x + 3\).
Now, when \(x = 5\):
- Step 1: Substitute \(x = 5\) into the equation
\(y=-16(5)^{2}+80(5)+3\)
\(y=-16\times25 + 400+3\)
\(y=-400 + 400+3\)
\(y = 3\) (But this is a bit misleading. Wait, let's check the data again. The height at \(x = 2\) is 9? Wait, the data for \(x = 2\) is probably a typo, maybe 93? Let's assume the data is \(x:0,0.5,1,1.5,2\) and \(y:3,39,67,87,93\). Let's recalculate the quadratic model.
Using \(x = 0,y = 3\) (so \(c = 3\)), \(x = 0.5,y = 39\): \(39=a(0.25)+b(0.5)+3\Rightarrow0.25a + 0.5b=36\)
\(x = 1,y = 67\): \(67=a + b+3\Rightarrow a + b=64\)
\(x = 1.5,y = 87\): \(87=a(2.25)+b(1.5)+3\Rightarrow2.25a+1.5b = 84\)
From \(a + b=64\), \(b = 64 - a\). Substitute into \(0.25a+0.5b = 36\):
\(0.25a+0.5(64 - a)=36\)
\(0.25a + 32-0.5a=36\)
\(-0.25a=4\Rightarrow a=-16\), \(b = 64+16 = 80\). Then for \(x = 2\), \(y=-16(4)+80(2)+3=-64 + 160+3 = 99\). If we use the equation \(y=-16x^{2}+80x + 3\), when \(x = 5\):
\(y=-16(25)+80(5)+3=-400 + 400+3 = 3\)
But in reality, a baseball hit into the air follows a parabolic path (quadratic function) and hits the ground (height 0 or near 0) after some time. The prediction of \(y = 3\) at \(x = 5\) seconds is based on the quadratic model we derived from the given data points.
Part b: Difference between Prediction and Actual Height
The actual height after 5 seconds is about 3 feet (close to the ground), while our prediction was also 3 feet. But if there was a mistake in the data or if we used an incorrect model, the difference could be due to several factors:
- Air resistance: The model we used (a quadratic model) assumes a projectile motion in a vacuum, but in reality, air resistance acts on the baseball, which changes its trajectory and the time it takes to fall.
- Measurement errors: The heights recorded at different times (the \(y\)-values) could have measurement errors, which would affect the accuracy of the model we derived.
- The baseball might hit an object (like the ground, a wall, etc.) before 5 seconds, but in our case, the actual height is about 3 feet, which is close to the ground, so it has landed, and the model's prediction of 3 feet is coincidentally close, but the underlying physics (with air resistance) is more complex than our simple quadratic model.
Final Answers
- a. Scatter plot with points \((30, 45)\), \((36, 43)\), \((44, 36)\), \((51, 35)\), \((60, 30)\), \((68, 27)\), \((75, 23)\), \((82, 17)\) and a line of fit showing negative linear trend.
b. \(y\approx - 0.54x + 61.2\) (approximate equation)
c. Slope: ~ - 0.54 (decrease in cups per °F increase), y - intercept: ~ 61.2 (cups at \(0^{\circ}\text{F}\))
- Equation of line of fit: \(y=-5x + 1040\), Expected attendance when free: 1040 visitors
- Active accounts for Website B: ~297 million (justification: linear model prediction)
- a. Predicted height: 3 feet (using \(y=-16x^{2}+80x + 3\))
b. Differences due to air resistance, measurement errors, or real - world trajectory changes.