QUESTION IMAGE
Question
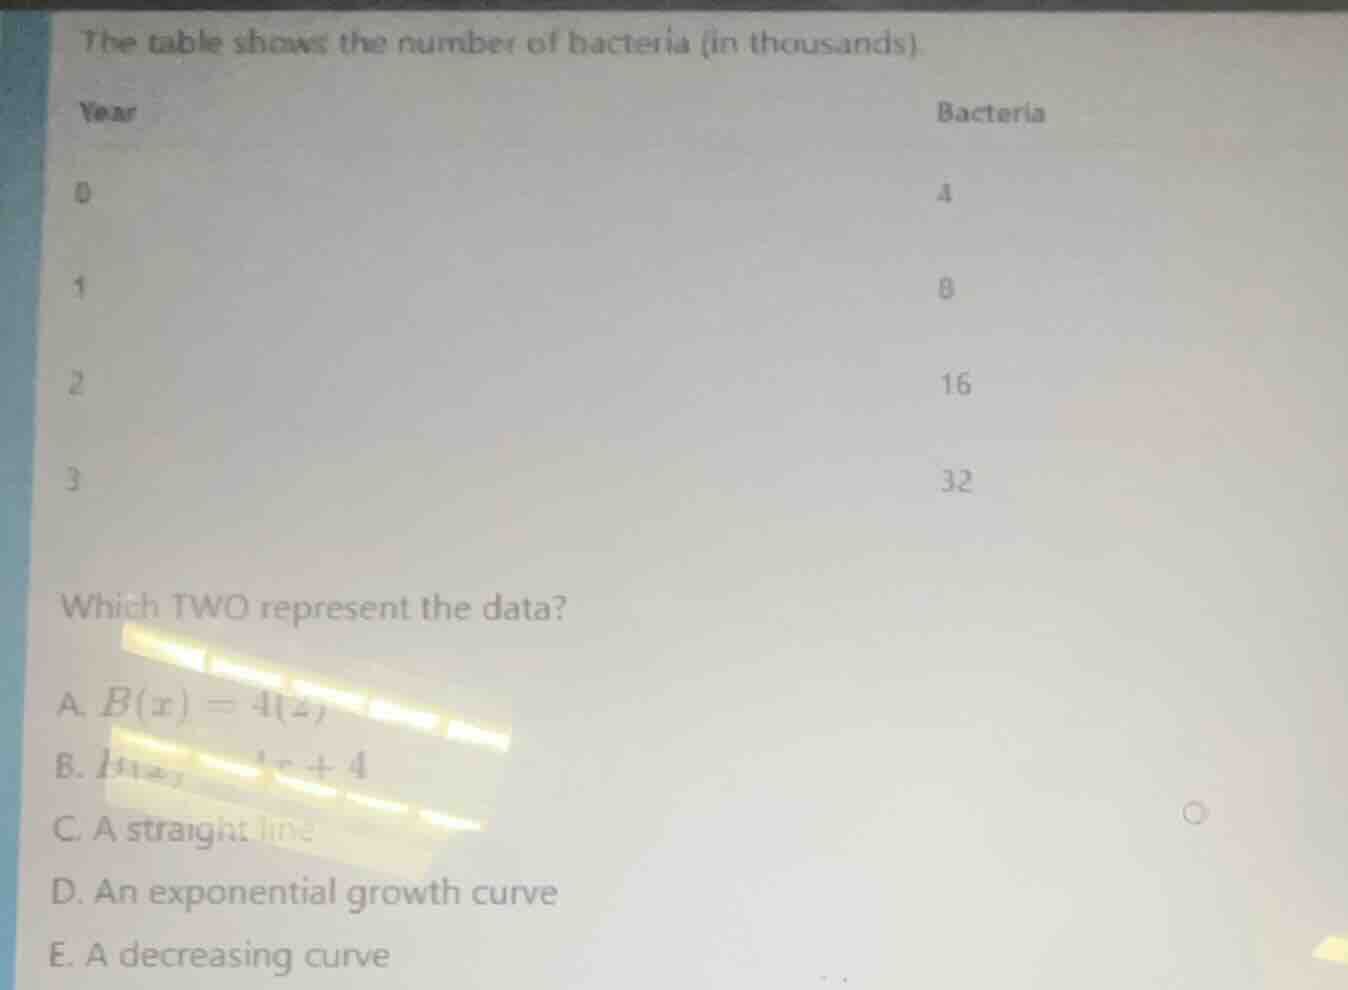
the table shows the number of bacteria (in thousands).
year\tbacteria
0\t4
1\t8
2\t16
3\t32
which two represent the data?
a. $b(x) = 4(2)$
b. $b(x) = 4x + 4$
c. a straight line
d. an exponential growth curve
e. a decreasing curve
Step1: Analyze the data pattern
Looking at the table, when \( x = 0 \), \( B = 4 \); \( x = 1 \), \( B = 8 \); \( x = 2 \), \( B = 16 \); \( x = 3 \), \( B = 32 \). We can see that each time \( x \) increases by 1, \( B \) is multiplied by 2. So the pattern is exponential growth. The general form of an exponential function is \( B(x)=a(b)^x \), where \( a = 4 \) (initial value when \( x = 0 \)) and \( b = 2 \) (common ratio). So the function is \( B(x)=4(2)^x \).
Step2: Analyze the curve type
Since the data follows an exponential function \( B(x)=4(2)^x \), it represents an exponential growth curve (because the base \( 2>1 \), so it's growth). A straight line would represent a linear function, but our data has a common ratio, not a common difference, so it's not linear. And the data is increasing, so it's not a decreasing curve.

Snap & solve any problem in the app
Get step-by-step solutions on Sovi AI
Photo-based solutions with guided steps
Explore more problems and detailed explanations
A. \( B(x) = 4(2)^x \)
D. An exponential growth curve