QUESTION IMAGE
Question
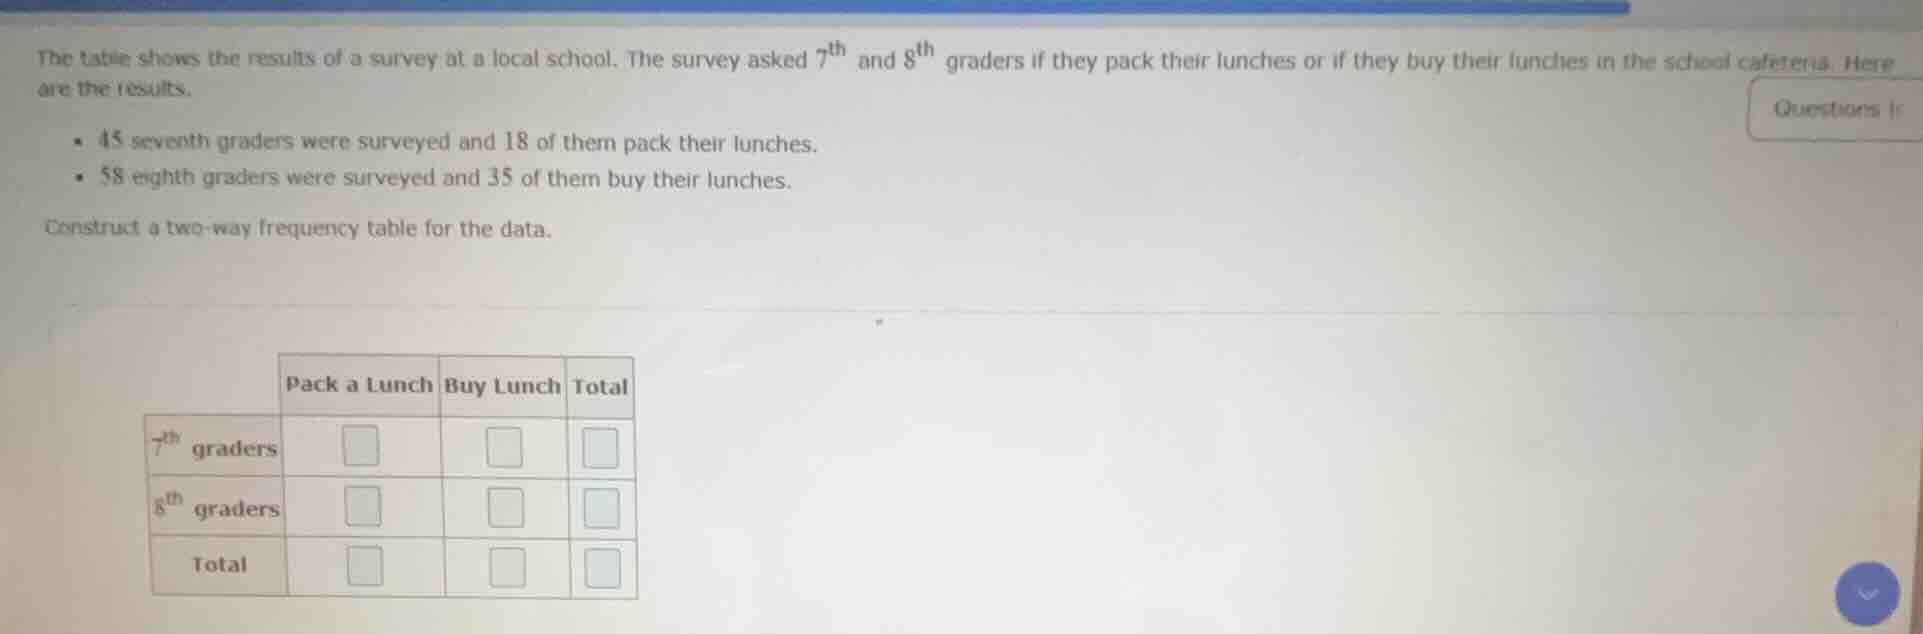
the table shows the results of a survey at a local school. the survey asked $7^{\text{th}}$ and $8^{\text{th}}$ graders if they pack their lunches or if they buy their lunches in the school cafeteria. here are the results. - 45 seventh graders were surveyed and 18 of them pack their lunches. - 58 eighth graders were surveyed and 35 of them buy their lunches. construct a two - way frequency table for the data. \
$$\begin{tabular}{|c|c|c|c|} \\hline & pack a lunch & buy lunch & total \\\\ \\hline $7^{\\text{th}}$ graders & $\\square$ & $\\square$ & $\\square$ \\\\ \\hline $8^{\\text{th}}$ graders & $\\square$ & $\\square$ & $\\square$ \\\\ \\hline total & $\\square$ & $\\square$ & $\\square$ \\\\ \\hline \\end{tabular}$$
Step1: Fill 7th grader known values
$7^\text{th}$ graders: Pack = 18, Total = 45
Step2: Calculate 7th graders who buy
$45 - 18 = 27$
Step3: Fill 8th grader known values
$8^\text{th}$ graders: Buy = 35, Total = 58
Step4: Calculate 8th graders who pack
$58 - 35 = 23$
Step5: Calculate total packers
$18 + 23 = 41$
Step6: Calculate total buyers
$27 + 35 = 62$
Step7: Calculate overall total
$45 + 58 = 103$

Snap & solve any problem in the app
Get step-by-step solutions on Sovi AI
Photo-based solutions with guided steps
Explore more problems and detailed explanations
| Pack a Lunch | Buy Lunch | Total | |
|---|---|---|---|
| 8th graders | 23 | 35 | 58 |
| Total | 41 | 62 | 103 |